Resource
| Id | Histone_ChIP-seq/ENCSR433FJP |
|---|---|
| Type | position_score |
| Version | 0 |
| Summary | Histone_ChIP-seq ENCSR433FJP [biosample_summary="Homo sapiens mesenchymal stem cell originated from H1" and target="H3K18ac"] |
| Description |
status: released biological_replicates: Rep 1 summary: male embryo output_type: pseudoreplicated peaks audit_internal_action: Released analysis {ENCAN007BIT|/analyses/ENCAN007BIT/} has in progress subobject quality standard {encode4-histone-chip|/quality-standards/encode4-histone-chip/} audit_internal_action: Released analysis {ENCAN007BIT|/analyses/ENCAN007BIT/} has in progress subobject document {f96f9802-55c1-495f-9cc7-03594779b870|/documents/f96f9802-55c1-495f-9cc7-03594779b870/} audit_warning: PBC1 (PCR Bottlenecking Coefficient 1, M1/M_distinct) is the ratio of the number of genomic locations where exactly one read maps uniquely (M1) to the number of genomic locations where some reads map (M_distinct). A PBC1 value in the range 0 - 0.5 is severe bottlenecking, 0.5 - 0.8 is moderate bottlenecking, 0.8 - 0.9 is mild bottlenecking, and > 0.9 is no bottlenecking. PBC1 value > 0.9 is recommended, but > 0.8 is acceptable. ENCODE processed alignments file {ENCFF884MEA|/files/ENCFF884MEA/} processed by ChIP-seq ENCODE4 v1.6.1 GRCh38 pipeline was generated from a library with PBC1 value of 0.90. |
| Labels |
|
Scores (1)
| ID | Type | Default annotation | Description | Histogram | Range | Summary |
|---|---|---|---|---|---|---|
| Histone_ChIP-seq_ENCSR433FJP | float |
Histone_ChIP-seq_ENCSR433FJP |
Histone_ChIP-seq ENCSR433FJP [biosample_summary="Homo sapiens mesenchymal stem cell originated from H1" and target="H3K18ac"]
|
 |
[1.78, 23.2] |
|
n counts base pairs; sd is the population standard deviation.
Coverage
| Chromosome | Covered positions | Covered % | Segments |
|---|---|---|---|
| all chromosomes | 37859955 | 1.18% | 99214 |
| chr1 | 3556481 | 1.43% | 9155 |
| chr2 | 3367348 | 1.39% | 8811 |
| chr3 | 2204024 | 1.11% | 6091 |
| chr4 | 1540120 | 0.81% | 4504 |
| chr5 | 2101407 | 1.16% | 5710 |
| chr6 | 1998124 | 1.17% | 5590 |
| chr7 | 1748409 | 1.10% | 4765 |
| chr8 | 1879644 | 1.30% | 5240 |
| chr9 | 1781939 | 1.29% | 4545 |
| chr10 | 2127165 | 1.59% | 5465 |
| chr11 | 2065276 | 1.53% | 5134 |
| chr12 | 1789098 | 1.34% | 4678 |
| chr13 | 920022 | 0.80% | 2644 |
| chr14 | 1169214 | 1.09% | 2973 |
| chr15 | 1308755 | 1.28% | 3355 |
| chr16 | 1390049 | 1.54% | 3262 |
| chr17 | 2055307 | 2.47% | 4761 |
| chr18 | 729575 | 0.91% | 2094 |
| chr19 | 1310777 | 2.24% | 3064 |
| chr20 | 1060747 | 1.65% | 2640 |
| chr21 | 471160 | 1.01% | 1231 |
| chr22 | 779243 | 1.53% | 1846 |
| chrX | 491447 | 0.31% | 1603 |
| chrY | 14624 | 0.03% | 53 |
| 3342 contigs with no values (129077085 bp) | 0 | 0.00% | 0 |
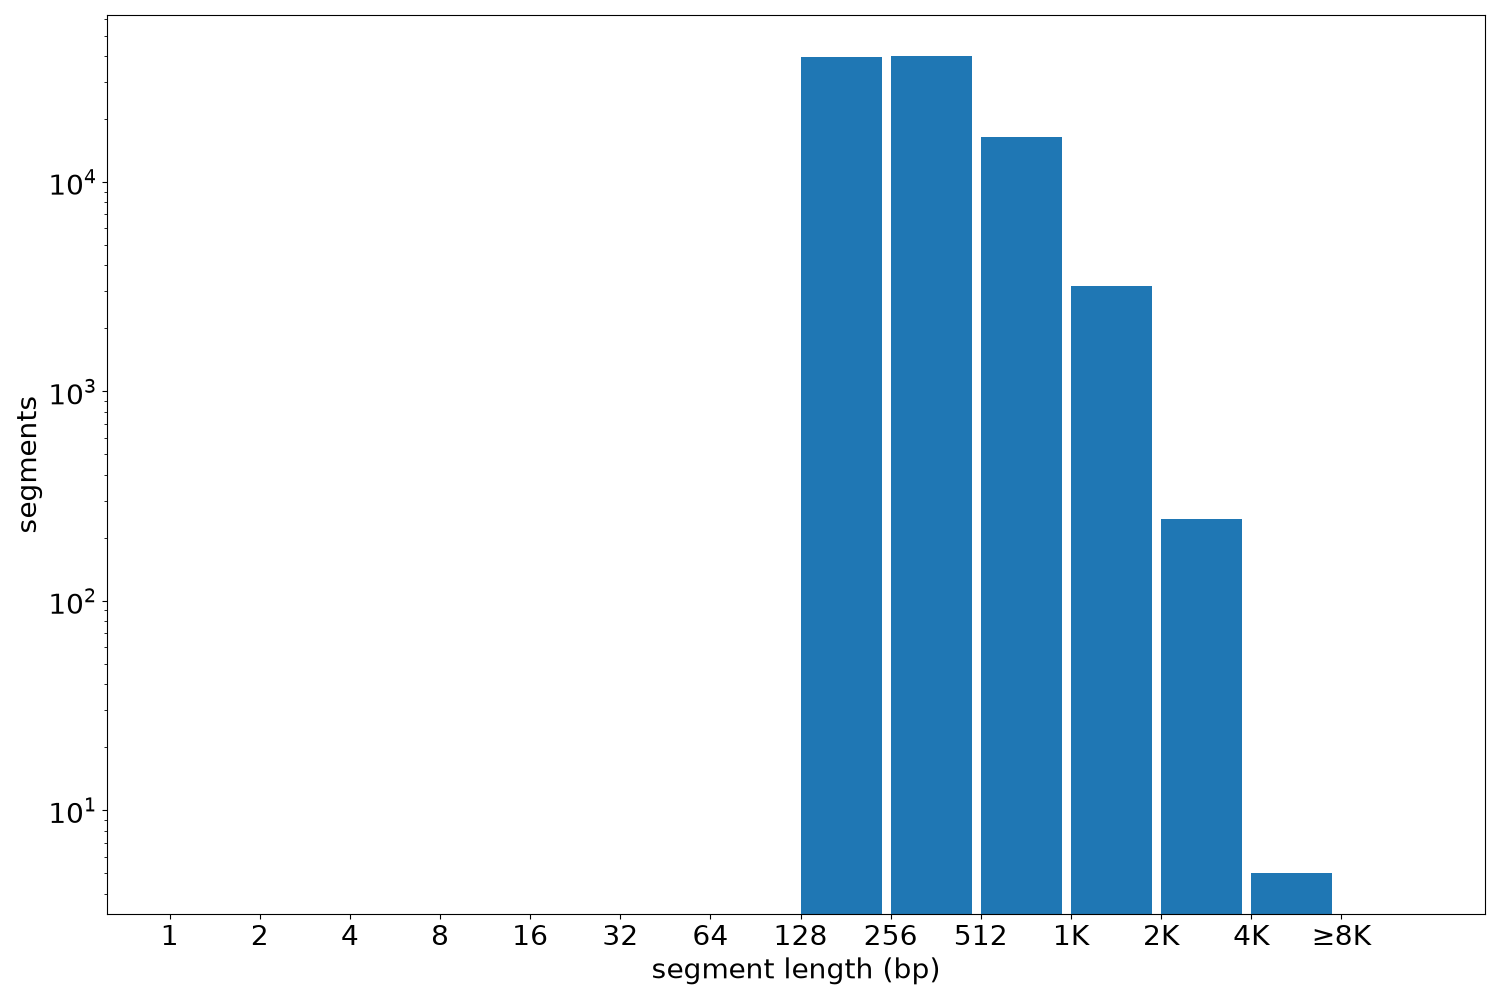
Segment lengths
| segments | min | max | mean | median | |
|---|---|---|---|---|---|
| segments | 99214 | 135 | 5221 | 381.6 | 297 |
Files
| Filename | Size | md5 |
|---|---|---|
| ENCFF460PEQ.bed.gz | 1.96 MB | 221cb2372c7ba510c6fd509df258ec65 |
| ENCFF460PEQ.tabix.bed.gz | 977.73 KB | 9839572175cbdb149411fb07e04e4387 |
| ENCFF460PEQ.tabix.bed.gz.tbi | 274.82 KB | 5343f06d01732c70477d57355bb5d11e |
| genomic_resource.yaml | 2.36 KB | 6c426d3c319aa73adb29edcc1410c7b0 |
| statistics/ |