Resource
| Id | Histone_ChIP-seq/ENCSR000DQP |
|---|---|
| Type | position_score |
| Version | 0 |
| Summary | Histone_ChIP-seq ENCSR000DQP [biosample_summary="Homo sapiens B cell female adult (43 years)" and target="H3K4me3"] |
| Description |
status: released biological_replicates: Rep 1, Rep 2 summary: female adult (43 years) output_type: replicated peaks audit_internal_action: Archived analysis {ENCAN279TAZ|/analyses/ENCAN279TAZ/} has in progress subobject quality standard {encode3-histone-chip|/quality-standards/encode3-histone-chip/} audit_warning: Processed alignments file {ENCFF642FEV|/files/ENCFF642FEV/} processed by ChIP-seq ENCODE3 GRCh38 pipeline has 14344681 usable fragments. The minimum ENCODE standard for each replicate in a ChIP-seq experiment targeting H3K4me3-human and investigated as a narrow histone mark is 10 million usable fragments. The recommended value is > 20 million, but > 10 million is acceptable. (See {ENCODE ChIP-seq data standards|/data-standards/chip-seq/}) audit_warning: Processed alignments file {ENCFF842FEQ|/files/ENCFF842FEQ/} processed by ChIP-seq ENCODE3 GRCh38 pipeline has 17755740 usable fragments. The minimum ENCODE standard for each replicate in a ChIP-seq experiment targeting H3K4me3-human and investigated as a narrow histone mark is 10 million usable fragments. The recommended value is > 20 million, but > 10 million is acceptable. (See {ENCODE ChIP-seq data standards|/data-standards/chip-seq/}) audit_warning: PBC1 (PCR Bottlenecking Coefficient 1, M1/M_distinct) is the ratio of the number of genomic locations where exactly one read maps uniquely (M1) to the number of genomic locations where some reads map (M_distinct). A PBC1 value in the range 0 - 0.5 is severe bottlenecking, 0.5 - 0.8 is moderate bottlenecking, 0.8 - 0.9 is mild bottlenecking, and > 0.9 is no bottlenecking. PBC1 value > 0.9 is recommended, but > 0.8 is acceptable. ENCODE processed alignments file {ENCFF642FEV|/files/ENCFF642FEV/} processed by ChIP-seq ENCODE3 GRCh38 pipeline was generated from a library with PBC1 value of 0.86. audit_warning: PBC2 (PCR Bottlenecking Coefficient 2, M1/M2) is the ratio of the number of genomic locations where exactly one read maps uniquely (M1) to the number of genomic locations where two reads map uniquely (M2). A PBC2 value in the range 0 - 1 is severe bottlenecking, 1 - 3 is moderate bottlenecking, 3 - 10 is mild bottlenecking, > 10 is no bottlenecking. PBC2 value > 10 is recommended, but > 3 is acceptable. ENCODE processed alignments file {ENCFF642FEV|/files/ENCFF642FEV/} processed by ChIP-seq ENCODE3 GRCh38 pipeline was generated from a library with PBC2 value of 7.64. audit_warning: PBC1 (PCR Bottlenecking Coefficient 1, M1/M_distinct) is the ratio of the number of genomic locations where exactly one read maps uniquely (M1) to the number of genomic locations where some reads map (M_distinct). A PBC1 value in the range 0 - 0.5 is severe bottlenecking, 0.5 - 0.8 is moderate bottlenecking, 0.8 - 0.9 is mild bottlenecking, and > 0.9 is no bottlenecking. PBC1 value > 0.9 is recommended, but > 0.8 is acceptable. ENCODE processed alignments file {ENCFF842FEQ|/files/ENCFF842FEQ/} processed by ChIP-seq ENCODE3 GRCh38 pipeline was generated from a library with PBC1 value of 0.83. audit_warning: PBC2 (PCR Bottlenecking Coefficient 2, M1/M2) is the ratio of the number of genomic locations where exactly one read maps uniquely (M1) to the number of genomic locations where two reads map uniquely (M2). A PBC2 value in the range 0 - 1 is severe bottlenecking, 1 - 3 is moderate bottlenecking, 3 - 10 is mild bottlenecking, > 10 is no bottlenecking. PBC2 value > 10 is recommended, but > 3 is acceptable. ENCODE processed alignments file {ENCFF842FEQ|/files/ENCFF842FEQ/} processed by ChIP-seq ENCODE3 GRCh38 pipeline was generated from a library with PBC2 value of 6.70. |
| Labels |
|
Scores (1)
| ID | Type | Default annotation | Description | Histogram | Range | Summary |
|---|---|---|---|---|---|---|
| Histone_ChIP-seq_ENCSR000DQP | float |
Histone_ChIP-seq_ENCSR000DQP |
Histone_ChIP-seq ENCSR000DQP [biosample_summary="Homo sapiens B cell female adult (43 years)" and target="H3K4me3"]
|
 |
[1.92, 157] |
|
n counts base pairs; sd is the population standard deviation.
Coverage
| Chromosome | Covered positions | Covered % | Segments |
|---|---|---|---|
| all chromosomes | 36894771 | 1.15% | 33363 |
| chr1 | 3665851 | 1.47% | 3267 |
| chr1_KI270712v1_random | 419 | 0.24% | 1 |
| chr1_KI270713v1_random | 816 | 2.00% | 3 |
| chr2 | 2553492 | 1.05% | 2412 |
| chr3 | 1996890 | 1.01% | 1854 |
| chr4 | 1329858 | 0.70% | 1184 |
| chr5 | 1655735 | 0.91% | 1455 |
| chr6 | 2358503 | 1.38% | 2052 |
| chr7 | 1757434 | 1.10% | 1605 |
| chr8 | 1388476 | 0.96% | 1333 |
| chr9 | 1444408 | 1.04% | 1344 |
| chr10 | 1529991 | 1.14% | 1460 |
| chr11 | 1941200 | 1.44% | 1655 |
| chr12 | 1949082 | 1.46% | 1736 |
| chr13 | 745457 | 0.65% | 709 |
| chr14 | 1245422 | 1.16% | 1104 |
| chr14_GL000194v1_random | 191 | 0.10% | 1 |
| chr15 | 1148003 | 1.13% | 1036 |
| chr16 | 1488340 | 1.65% | 1339 |
| chr17 | 2202107 | 2.64% | 1892 |
| chr17_GL000205v2_random | 2333 | 1.26% | 2 |
| chr18 | 601404 | 0.75% | 594 |
| chr19 | 2500161 | 4.27% | 2143 |
| chr20 | 964770 | 1.50% | 915 |
| chr21 | 352939 | 0.76% | 340 |
| chr22 | 889391 | 1.75% | 840 |
| chr22_KI270733v1_random | 198 | 0.11% | 1 |
| chrUn_GL000219v1 | 1851 | 1.03% | 4 |
| chrUn_GL000220v1 | 521 | 0.32% | 2 |
| chrX | 1179528 | 0.76% | 1080 |
| 3336 contigs with no values (185189880 bp) | 0 | 0.00% | 0 |
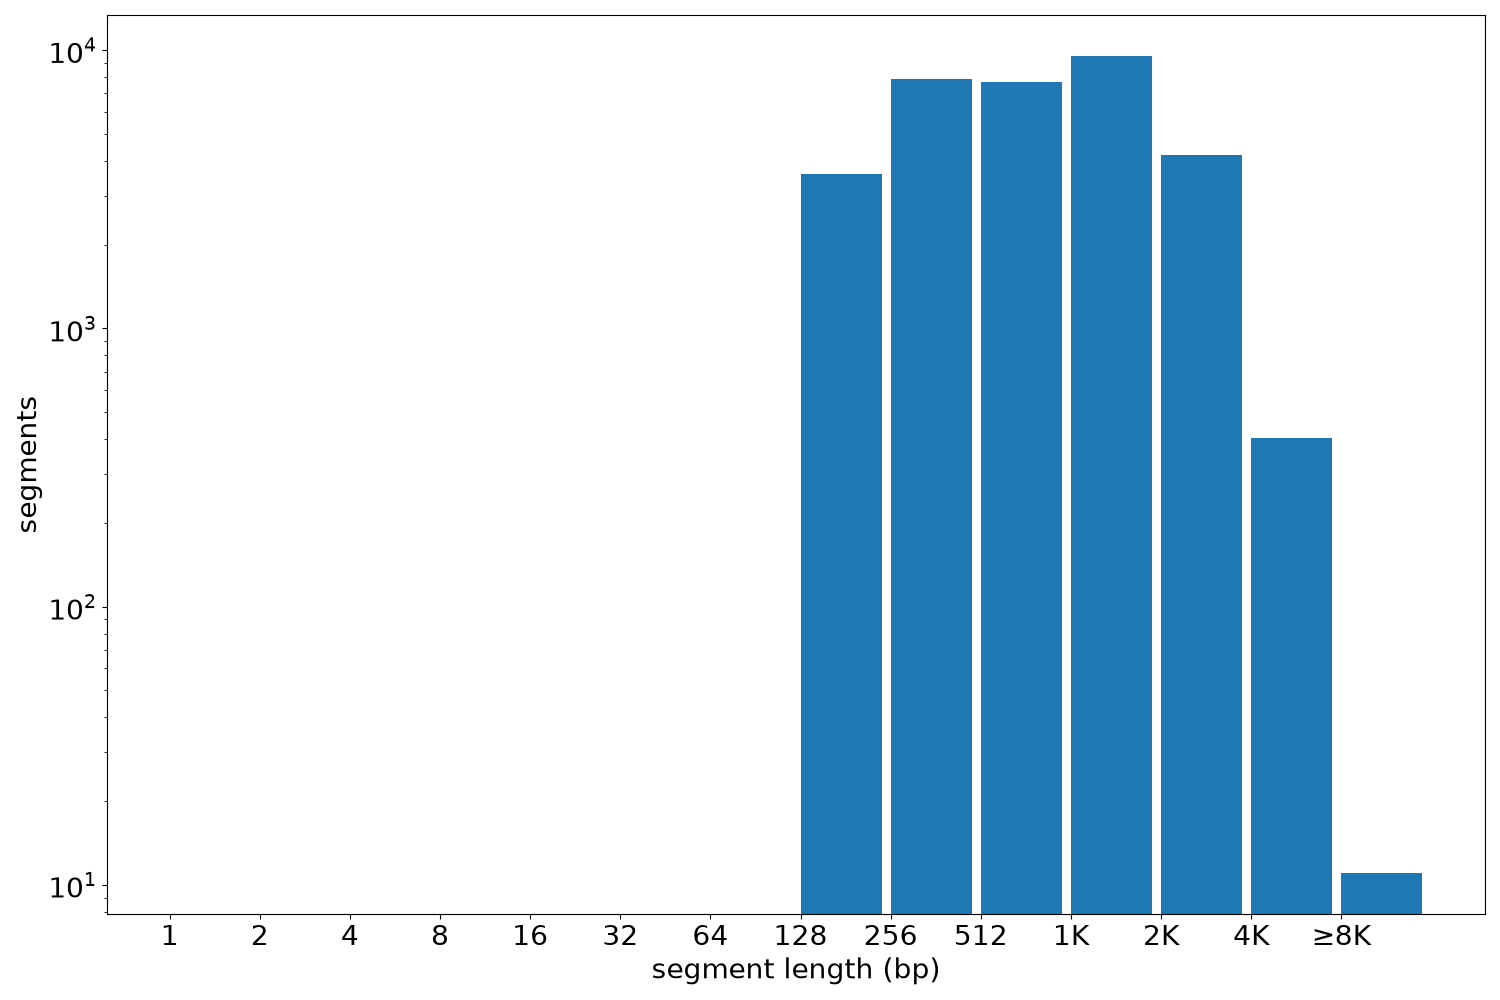
Segment lengths
| segments | min | max | mean | median | |
|---|---|---|---|---|---|
| segments | 33363 | 175 | 12602 | 1105.86 | 816 |
Files
| Filename | Size | md5 |
|---|---|---|
| ENCFF258BVG.bed.gz | 845.25 KB | a2bceb3af83d90c01e8f45daa2d2242c |
| ENCFF258BVG.tabix.bed.gz | 374.11 KB | e4987e7fb3b8574b9142f056032f1a4f |
| ENCFF258BVG.tabix.bed.gz.tbi | 176.0 KB | 7e778122e954effba32f9179fde8b3fb |
| genomic_resource.yaml | 5.23 KB | 422e9515ee7dbc1327917393fce35cef |
| statistics/ |