Resource
| Id | DNase-seq/ENCSR000EKQ |
|---|---|
| Type | position_score |
| Version | 0 |
| Summary | DNase-seq ENCSR000EKQ [biosample_summary="Homo sapiens K562 G1 phase"] |
| Description |
status: released biological_replicates: Rep 1 summary: G1 phase output_type: peaks audit_internal_action: Released analysis {ENCAN856HRK|/analyses/ENCAN856HRK/} has in progress subobject document {687d5617-4d01-4e29-9d50-0c32f53bce71|/documents/687d5617-4d01-4e29-9d50-0c32f53bce71/} audit_warning: Signal Portion of Tags (SPOT) is a measure of enrichment, analogous to the commonly used fraction of reads in peaks metric. ENCODE processed alignment files {ENCFF708UMH|/files/ENCFF708UMH/} processed by DNase-seq ENCODE4 v3.0.0 GRCh38 pipeline ({ENCPL848KLD|/pipelines/ENCPL848KLD/}) for GRCh38 assembly have a SPOT1 score of 0.27. According to ENCODE standards, SPOT1 score of 0.4 or higher is considered a product of high quality data. Any sample with a SPOT1 score <0.3 should be targeted for replacement with a higher quality sample, and a SPOT1 score of 0.25 is considered minimally acceptable SPOT1 score of 0.25 is considered minimally acceptable for rare and hard to find primary tissues. (See {ENCODE DNase-seq data standards|/data-standards/dnase-seq-encode4/}) |
| Labels |
|
Scores (1)
| ID | Type | Default annotation | Description | Histogram | Range | Summary |
|---|---|---|---|---|---|---|
| DNase-seq_ENCSR000EKQ | float |
DNase-seq_ENCSR000EKQ |
DNase-seq ENCSR000EKQ [biosample_summary="Homo sapiens K562 G1 phase"]
|
 |
[0.024, 42.9] |
|
n counts base pairs; sd is the population standard deviation.
Coverage
| Chromosome | Covered positions | Covered % | Segments |
|---|---|---|---|
| all chromosomes | 20016090 | 0.62% | 106755 |
| chr1 | 2076493 | 0.83% | 10950 |
| chr2 | 1285297 | 0.53% | 7006 |
| chr3 | 1090474 | 0.55% | 5880 |
| chr4 | 674291 | 0.35% | 3698 |
| chr5 | 875931 | 0.48% | 4735 |
| chr6 | 1076950 | 0.63% | 5811 |
| chr7 | 1053833 | 0.66% | 5699 |
| chr8 | 744453 | 0.51% | 4075 |
| chr9 | 881698 | 0.64% | 4740 |
| chr10 | 876551 | 0.66% | 4716 |
| chr11 | 1075588 | 0.80% | 5706 |
| chr12 | 967591 | 0.73% | 5170 |
| chr13 | 392066 | 0.34% | 2059 |
| chr14 | 570803 | 0.53% | 3040 |
| chr15 | 616340 | 0.60% | 3299 |
| chr16 | 870620 | 0.96% | 4547 |
| chr17 | 1116780 | 1.34% | 5772 |
| chr18 | 300148 | 0.37% | 1652 |
| chr19 | 1403439 | 2.39% | 7091 |
| chr20 | 617055 | 0.96% | 3315 |
| chr21 | 206715 | 0.44% | 1143 |
| chr22 | 676487 | 1.33% | 3618 |
| chrX | 565784 | 0.36% | 3026 |
| chrY | 703 | <0.01% | 7 |
| 3342 contigs with no values (129077085 bp) | 0 | 0.00% | 0 |
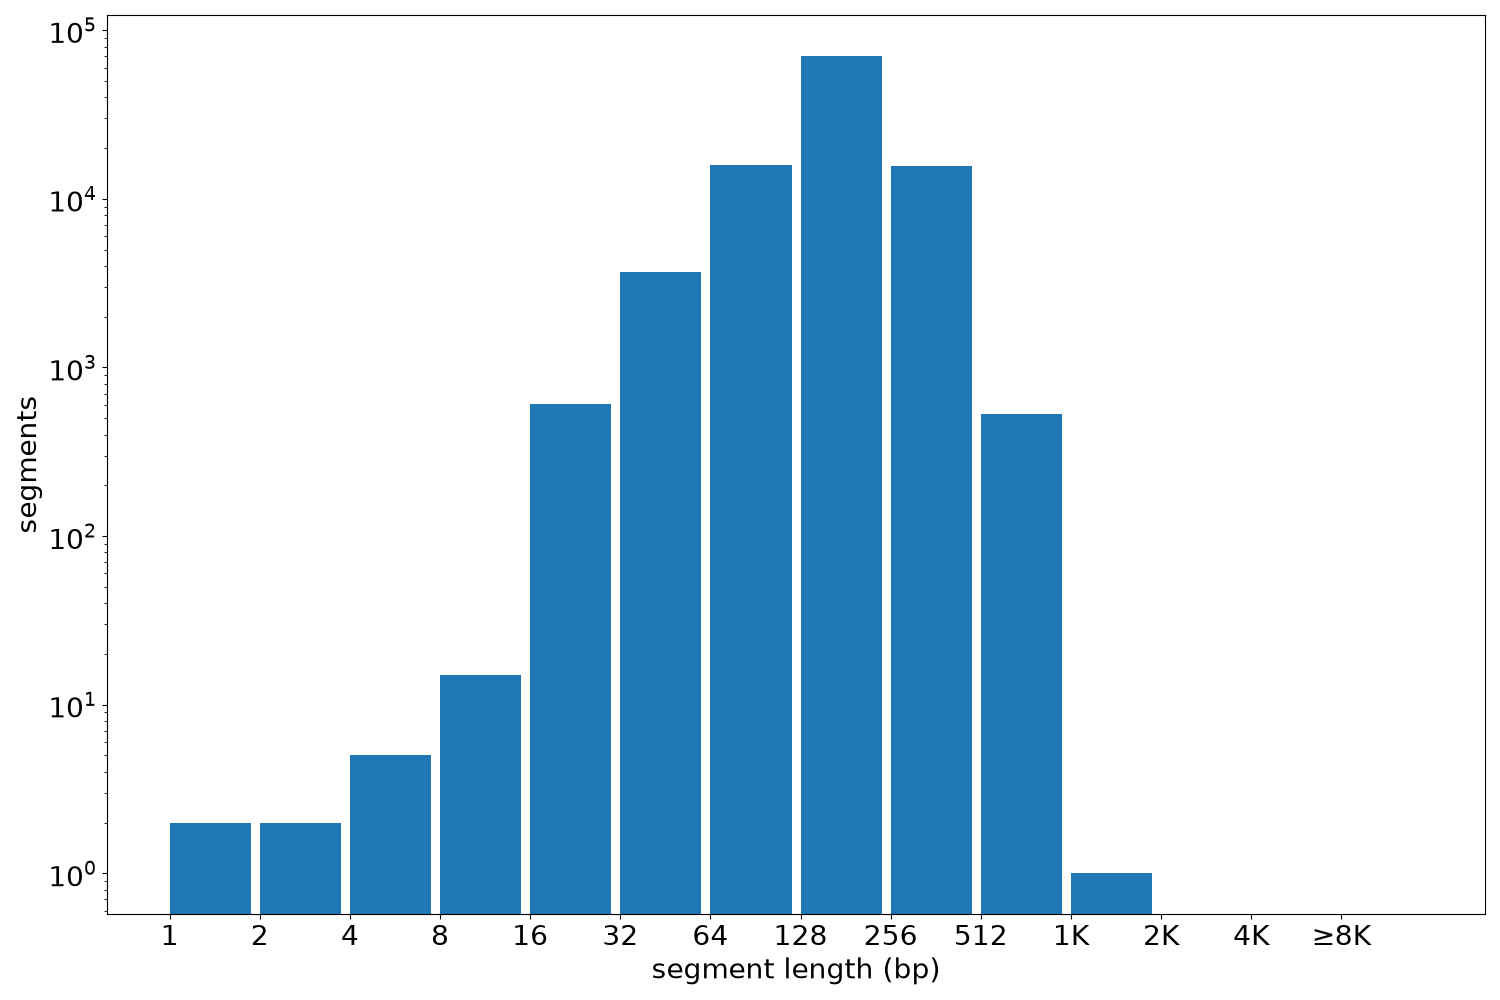
Segment lengths
| segments | min | max | mean | median | |
|---|---|---|---|---|---|
| segments | 106755 | 1 | 1120 | 187.5 | 180 |
Files
| Filename | Size | md5 |
|---|---|---|
| ENCFF628UDH.bed.gz | 1.16 MB | 7172d67947189cde5e584529f0f1048f |
| ENCFF628UDH.tabix.bed.gz | 1.06 MB | 1fc9c871b07e1640faeb3dfae9818279 |
| ENCFF628UDH.tabix.bed.gz.tbi | 387.08 KB | 0750b0d6339de67c127c98d95a410d04 |
| genomic_resource.yaml | 2.13 KB | 0d12701fb1fccce927da9569229a3600 |
| statistics/ |