Resource
| Id | TF_ChIP-seq/ENCSR000BSB |
|---|---|
| Type | position_score |
| Version | 0 |
| Summary | TF_ChIP-seq ENCSR000BSB [biosample_summary="Homo sapiens HCT116" and target="RAD21"] |
| Description |
status: released biological_replicates: Rep 1, Rep 2 summary: output_type: IDR thresholded peaks audit_internal_action: Released analysis {ENCAN144PCH|/analyses/ENCAN144PCH/} has in progress subobject document {aebfcef7-5387-4027-9168-22ddf593718c|/documents/aebfcef7-5387-4027-9168-22ddf593718c/} audit_internal_action: Released analysis {ENCAN144PCH|/analyses/ENCAN144PCH/} has in progress subobject quality standard {encode4-tf-chip|/quality-standards/encode4-tf-chip/} audit_warning: Processed alignments file {ENCFF973DXN|/files/ENCFF973DXN/} processed by ChIP-seq ENCODE4 v1.6.1 GRCh38 pipeline has 16137316 usable fragments. The minimum ENCODE standard for each replicate in a ChIP-seq experiment targeting RAD21-human and investigated as a transcription factor is 10 million usable fragments. The recommended value is > 20 million, but > 10 million is acceptable. (See {ENCODE ChIP-seq data standards|/data-standards/chip-seq/} ) audit_warning: PBC1 (PCR Bottlenecking Coefficient 1, M1/M_distinct) is the ratio of the number of genomic locations where exactly one read maps uniquely (M1) to the number of genomic locations where some reads map (M_distinct). A PBC1 value in the range 0 - 0.5 is severe bottlenecking, 0.5 - 0.8 is moderate bottlenecking, 0.8 - 0.9 is mild bottlenecking, and > 0.9 is no bottlenecking. PBC1 value > 0.9 is recommended, but > 0.8 is acceptable. ENCODE processed alignments file {ENCFF761EMD|/files/ENCFF761EMD/} processed by ChIP-seq ENCODE4 v1.6.1 GRCh38 pipeline was generated from a library with PBC1 value of 0.89. |
| Labels |
|
Scores (1)
| ID | Type | Default annotation | Description | Histogram | Range | Summary |
|---|---|---|---|---|---|---|
| TF_ChIP-seq_ENCSR000BSB | float |
TF_ChIP-seq_ENCSR000BSB |
TF_ChIP-seq ENCSR000BSB [biosample_summary="Homo sapiens HCT116" and target="RAD21"]
|
 |
[4.4, 606] |
|
n counts base pairs; sd is the population standard deviation.
Coverage
| Chromosome | Covered positions | Covered % | Segments |
|---|---|---|---|
| all chromosomes | 13051771 | 0.41% | 52115 |
| chr1 | 1263792 | 0.51% | 5065 |
| chr2 | 1140949 | 0.47% | 4549 |
| chr3 | 881512 | 0.44% | 3495 |
| chr4 | 730575 | 0.38% | 2913 |
| chr5 | 717511 | 0.40% | 2866 |
| chr6 | 861141 | 0.50% | 3435 |
| chr7 | 711408 | 0.45% | 2856 |
| chr8 | 634991 | 0.44% | 2504 |
| chr9 | 517342 | 0.37% | 2045 |
| chr10 | 678417 | 0.51% | 2666 |
| chr11 | 639849 | 0.47% | 2567 |
| chr12 | 708879 | 0.53% | 2867 |
| chr13 | 283594 | 0.25% | 1129 |
| chr14 | 396010 | 0.37% | 1576 |
| chr15 | 386456 | 0.38% | 1559 |
| chr16 | 353650 | 0.39% | 1408 |
| chr17 | 556487 | 0.67% | 2231 |
| chr18 | 249606 | 0.31% | 995 |
| chr19 | 349181 | 0.60% | 1425 |
| chr20 | 333409 | 0.52% | 1348 |
| chr21 | 84337 | 0.18% | 337 |
| chr22 | 216156 | 0.43% | 862 |
| chrX | 352799 | 0.23% | 1405 |
| chrY | 3720 | 0.01% | 12 |
| 3342 contigs with no values (129077085 bp) | 0 | 0.00% | 0 |
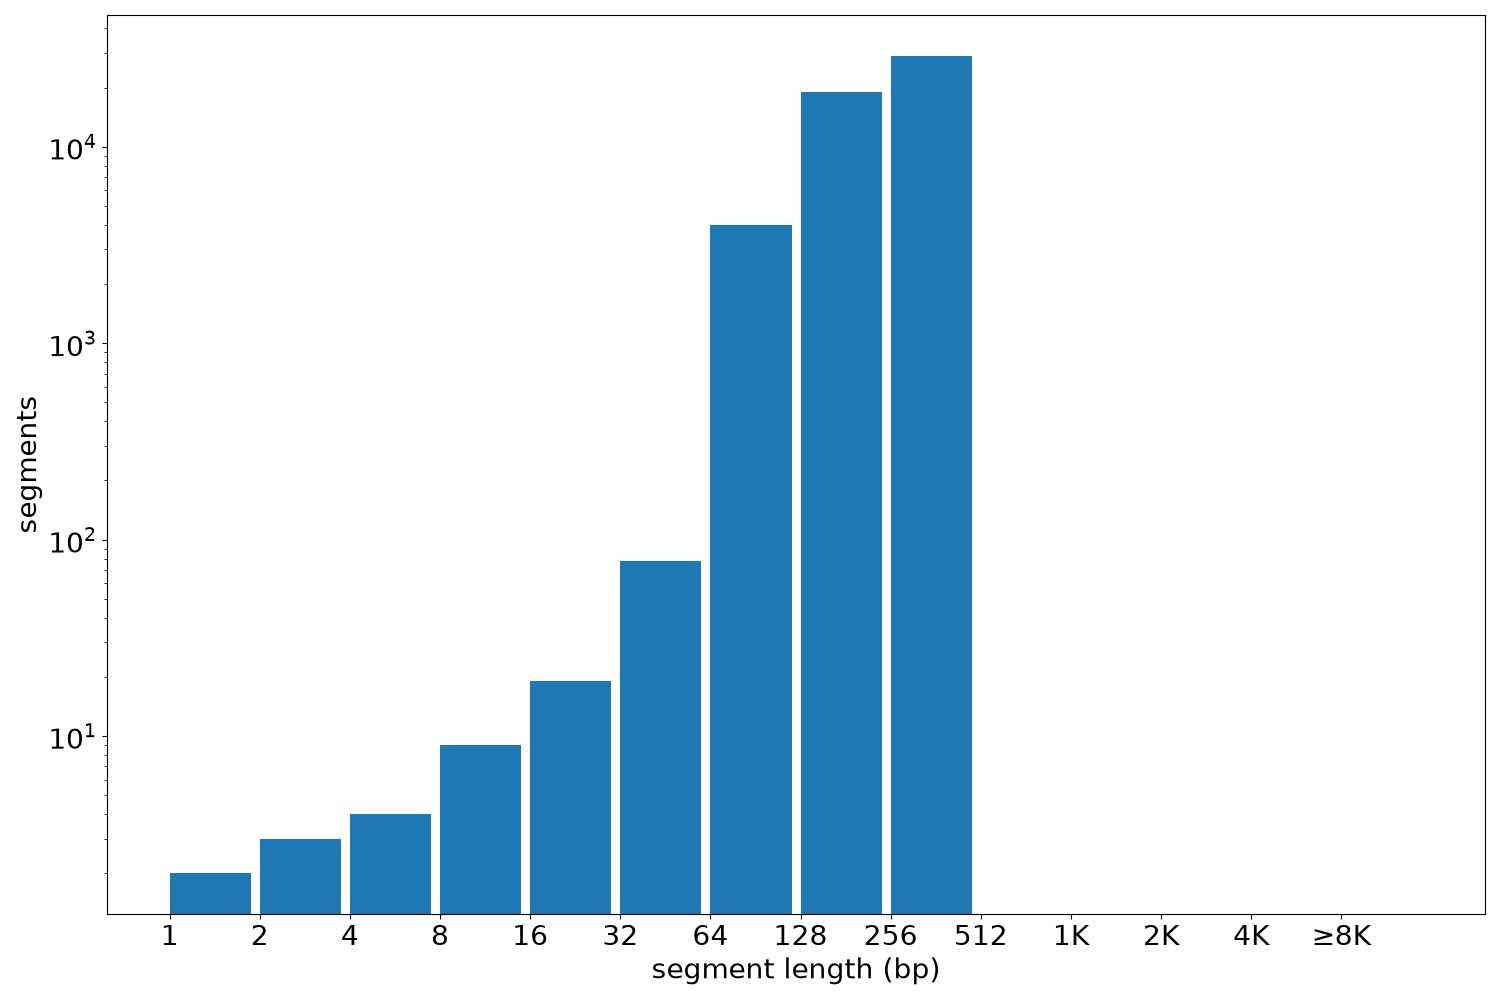
Segment lengths
| segments | min | max | mean | median | |
|---|---|---|---|---|---|
| segments | 52115 | 1 | 489 | 250.44 | 310 |
Files
| Filename | Size | md5 |
|---|---|---|
| ENCFF391AAM.bed.gz | 847.98 KB | 66f1c23ae099104ebeadb25e9257d6da |
| ENCFF391AAM.tabix.bed.gz | 612.36 KB | 6288a65111729bf2caf7d937ecb4c0a0 |
| ENCFF391AAM.tabix.bed.gz.tbi | 311.98 KB | 396b43142b32c11dfa90addc85a19b54 |
| genomic_resource.yaml | 2.73 KB | c540214eb7948245dd9591dc514fce26 |
| statistics/ |