Resource
| Id | TF_ChIP-seq/ENCSR000BRS |
|---|---|
| Type | position_score |
| Version | 0 |
| Summary | TF_ChIP-seq ENCSR000BRS [biosample_summary="Homo sapiens K562" and target="NR2F2"] |
| Description |
status: released biological_replicates: Rep 1, Rep 2 summary: output_type: optimal IDR thresholded peaks audit_internal_action: Archived analysis {ENCAN573LNZ|/analyses/ENCAN573LNZ/} has in progress subobject quality standard {encode3-tf-chip|/quality-standards/encode3-tf-chip/} audit_warning: Processed alignments file {ENCFF422ZRF|/files/ENCFF422ZRF/} processed by ChIP-seq ENCODE3 hg19 pipeline has 17189903 usable fragments. The minimum ENCODE standard for each replicate in a ChIP-seq experiment targeting NR2F2-human and investigated as a transcription factor is 10 million usable fragments. The recommended value is > 20 million, but > 10 million is acceptable. (See {ENCODE ChIP-seq data standards|/data-standards/chip-seq/} ) audit_warning: PBC1 (PCR Bottlenecking Coefficient 1, M1/M_distinct) is the ratio of the number of genomic locations where exactly one read maps uniquely (M1) to the number of genomic locations where some reads map (M_distinct). A PBC1 value in the range 0 - 0.5 is severe bottlenecking, 0.5 - 0.8 is moderate bottlenecking, 0.8 - 0.9 is mild bottlenecking, and > 0.9 is no bottlenecking. PBC1 value > 0.9 is recommended, but > 0.8 is acceptable. ENCODE processed alignments file {ENCFF422ZRF|/files/ENCFF422ZRF/} processed by ChIP-seq ENCODE3 hg19 pipeline was generated from a library with PBC1 value of 0.81. audit_warning: PBC2 (PCR Bottlenecking Coefficient 2, M1/M2) is the ratio of the number of genomic locations where exactly one read maps uniquely (M1) to the number of genomic locations where two reads map uniquely (M2). A PBC2 value in the range 0 - 1 is severe bottlenecking, 1 - 3 is moderate bottlenecking, 3 - 10 is mild bottlenecking, > 10 is no bottlenecking. PBC2 value > 10 is recommended, but > 3 is acceptable. ENCODE processed alignments file {ENCFF422ZRF|/files/ENCFF422ZRF/} processed by ChIP-seq ENCODE3 hg19 pipeline was generated from a library with PBC2 value of 5.21. |
| Labels |
|
Scores (1)
| ID | Type | Default annotation | Description | Histogram | Range | Summary |
|---|---|---|---|---|---|---|
| TF_ChIP-seq_ENCSR000BRS | float |
TF_ChIP-seq_ENCSR000BRS |
TF_ChIP-seq ENCSR000BRS [biosample_summary="Homo sapiens K562" and target="NR2F2"]
|
 |
[7.7, 562] |
|
n counts base pairs; sd is the population standard deviation.
Coverage
| Chromosome | Covered positions | Covered % | Segments |
|---|---|---|---|
| all chromosomes | 7092564 | 0.22% | 22867 |
| chr1 | 974687 | 0.39% | 3164 |
| chr2 | 497025 | 0.21% | 1607 |
| chr3 | 422993 | 0.21% | 1359 |
| chr4 | 257847 | 0.14% | 812 |
| chr5 | 326082 | 0.18% | 1037 |
| chr6 | 571946 | 0.33% | 1853 |
| chr7 | 467254 | 0.29% | 1508 |
| chr8 | 287586 | 0.20% | 935 |
| chr9 | 233699 | 0.17% | 769 |
| chr10 | 292518 | 0.22% | 925 |
| chr11 | 379772 | 0.28% | 1224 |
| chr12 | 357508 | 0.27% | 1156 |
| chr13 | 63845 | 0.06% | 201 |
| chr14 | 120531 | 0.11% | 377 |
| chr15 | 200370 | 0.20% | 645 |
| chr16 | 260911 | 0.29% | 855 |
| chr17 | 360919 | 0.43% | 1190 |
| chr18 | 91039 | 0.11% | 291 |
| chr19 | 386082 | 0.66% | 1256 |
| chr20 | 161068 | 0.25% | 509 |
| chr21 | 84315 | 0.18% | 266 |
| chr22 | 157032 | 0.31% | 503 |
| chrX | 137535 | 0.09% | 425 |
| 3343 contigs with no values (186304500 bp) | 0 | 0.00% | 0 |
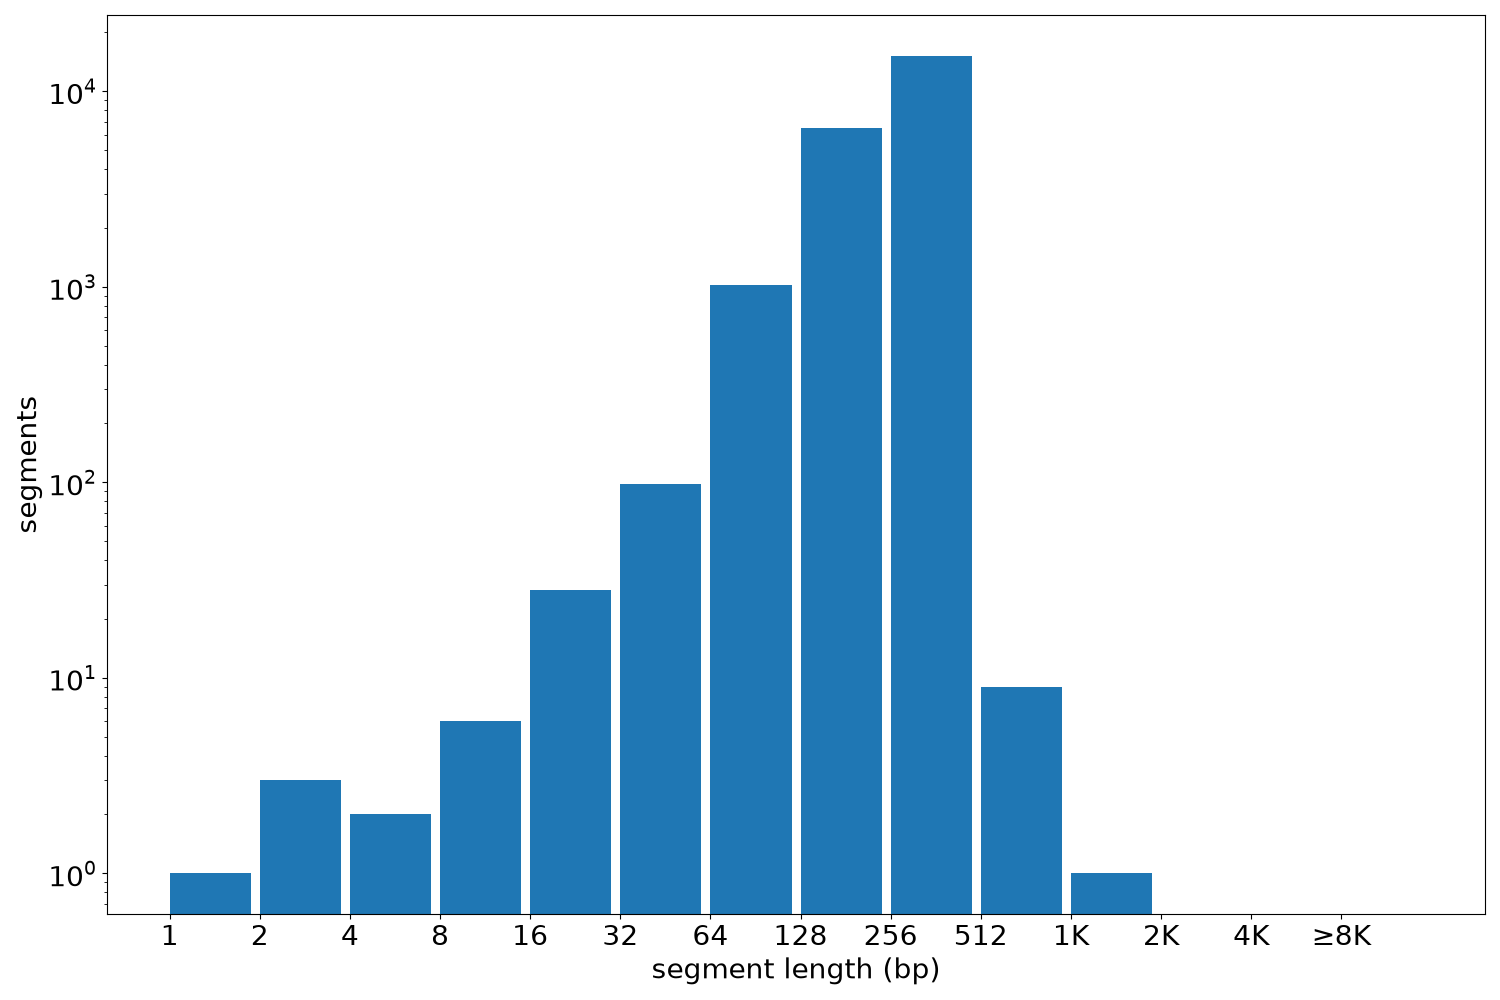
Segment lengths
| segments | min | max | mean | median | |
|---|---|---|---|---|---|
| segments | 22867 | 1 | 1088 | 310.17 | 384 |
Files
| Filename | Size | md5 |
|---|---|---|
| ENCFF255EOB.bed.gz | 350.68 KB | 261091a7cd8dcdf58adf98e3c6d32d2b |
| ENCFF255EOB.tabix.bed.gz | 266.25 KB | dbf85a660bbddfab01b5ed631f9debc0 |
| ENCFF255EOB.tabix.bed.gz.tbi | 129.89 KB | c9279e5f59aa2afadb087d9c2bcd8347 |
| genomic_resource.yaml | 3.14 KB | 8332127529d32a8a6c3890e3ad519b38 |
| statistics/ |