Resource
| Id | TF_ChIP-seq/ENCSR000BRN |
|---|---|
| Type | position_score |
| Version | 0 |
| Summary | TF_ChIP-seq ENCSR000BRN [biosample_summary="Homo sapiens GM12878" and target="NFIC"] |
| Description |
status: released biological_replicates: Rep 1, Rep 2 summary: output_type: optimal IDR thresholded peaks audit_internal_action: Archived analysis {ENCAN777YDC|/analyses/ENCAN777YDC/} has in progress subobject quality standard {encode3-tf-chip|/quality-standards/encode3-tf-chip/} audit_warning: Processed alignments file {ENCFF617HLC|/files/ENCFF617HLC/} processed by ChIP-seq ENCODE3 hg19 pipeline has 16766618 usable fragments. The minimum ENCODE standard for each replicate in a ChIP-seq experiment targeting NFIC-human and investigated as a transcription factor is 10 million usable fragments. The recommended value is > 20 million, but > 10 million is acceptable. (See {ENCODE ChIP-seq data standards|/data-standards/chip-seq/} ) audit_warning: Processed alignments file {ENCFF930KIJ|/files/ENCFF930KIJ/} processed by ChIP-seq ENCODE3 hg19 pipeline has 18543238 usable fragments. The minimum ENCODE standard for each replicate in a ChIP-seq experiment targeting NFIC-human and investigated as a transcription factor is 10 million usable fragments. The recommended value is > 20 million, but > 10 million is acceptable. (See {ENCODE ChIP-seq data standards|/data-standards/chip-seq/} ) audit_warning: PBC1 (PCR Bottlenecking Coefficient 1, M1/M_distinct) is the ratio of the number of genomic locations where exactly one read maps uniquely (M1) to the number of genomic locations where some reads map (M_distinct). A PBC1 value in the range 0 - 0.5 is severe bottlenecking, 0.5 - 0.8 is moderate bottlenecking, 0.8 - 0.9 is mild bottlenecking, and > 0.9 is no bottlenecking. PBC1 value > 0.9 is recommended, but > 0.8 is acceptable. ENCODE processed alignments file {ENCFF617HLC|/files/ENCFF617HLC/} processed by ChIP-seq ENCODE3 hg19 pipeline was generated from a library with PBC1 value of 0.81. audit_warning: PBC2 (PCR Bottlenecking Coefficient 2, M1/M2) is the ratio of the number of genomic locations where exactly one read maps uniquely (M1) to the number of genomic locations where two reads map uniquely (M2). A PBC2 value in the range 0 - 1 is severe bottlenecking, 1 - 3 is moderate bottlenecking, 3 - 10 is mild bottlenecking, > 10 is no bottlenecking. PBC2 value > 10 is recommended, but > 3 is acceptable. ENCODE processed alignments file {ENCFF617HLC|/files/ENCFF617HLC/} processed by ChIP-seq ENCODE3 hg19 pipeline was generated from a library with PBC2 value of 5.54. audit_warning: PBC1 (PCR Bottlenecking Coefficient 1, M1/M_distinct) is the ratio of the number of genomic locations where exactly one read maps uniquely (M1) to the number of genomic locations where some reads map (M_distinct). A PBC1 value in the range 0 - 0.5 is severe bottlenecking, 0.5 - 0.8 is moderate bottlenecking, 0.8 - 0.9 is mild bottlenecking, and > 0.9 is no bottlenecking. PBC1 value > 0.9 is recommended, but > 0.8 is acceptable. ENCODE processed alignments file {ENCFF930KIJ|/files/ENCFF930KIJ/} processed by ChIP-seq ENCODE3 hg19 pipeline was generated from a library with PBC1 value of 0.86. audit_warning: PBC2 (PCR Bottlenecking Coefficient 2, M1/M2) is the ratio of the number of genomic locations where exactly one read maps uniquely (M1) to the number of genomic locations where two reads map uniquely (M2). A PBC2 value in the range 0 - 1 is severe bottlenecking, 1 - 3 is moderate bottlenecking, 3 - 10 is mild bottlenecking, > 10 is no bottlenecking. PBC2 value > 10 is recommended, but > 3 is acceptable. ENCODE processed alignments file {ENCFF930KIJ|/files/ENCFF930KIJ/} processed by ChIP-seq ENCODE3 hg19 pipeline was generated from a library with PBC2 value of 6.94. |
| Labels |
|
Scores (1)
| ID | Type | Default annotation | Description | Histogram | Range | Summary |
|---|---|---|---|---|---|---|
| TF_ChIP-seq_ENCSR000BRN | float |
TF_ChIP-seq_ENCSR000BRN |
TF_ChIP-seq ENCSR000BRN [biosample_summary="Homo sapiens GM12878" and target="NFIC"]
|
 |
[6.62, 452] |
|
n counts base pairs; sd is the population standard deviation.
Coverage
| Chromosome | Covered positions | Covered % | Segments |
|---|---|---|---|
| all chromosomes | 16732996 | 0.52% | 44504 |
| chr1 | 1498473 | 0.60% | 3910 |
| chr2 | 1399680 | 0.58% | 3743 |
| chr3 | 1257964 | 0.63% | 3362 |
| chr4 | 824431 | 0.43% | 2215 |
| chr5 | 1007589 | 0.56% | 2725 |
| chr6 | 1303804 | 0.76% | 3551 |
| chr7 | 812873 | 0.51% | 2149 |
| chr8 | 809631 | 0.56% | 2150 |
| chr9 | 631707 | 0.46% | 1646 |
| chr10 | 793666 | 0.59% | 2096 |
| chr11 | 778064 | 0.58% | 2049 |
| chr12 | 963358 | 0.72% | 2547 |
| chr13 | 431052 | 0.38% | 1109 |
| chr14 | 584949 | 0.55% | 1588 |
| chr15 | 480613 | 0.47% | 1288 |
| chr16 | 498611 | 0.55% | 1346 |
| chr17 | 664755 | 0.80% | 1782 |
| chr18 | 372829 | 0.46% | 1002 |
| chr19 | 454605 | 0.78% | 1194 |
| chr20 | 385208 | 0.60% | 988 |
| chr21 | 182326 | 0.39% | 508 |
| chr22 | 249526 | 0.49% | 643 |
| chrX | 347282 | 0.22% | 913 |
| 3343 contigs with no values (186304500 bp) | 0 | 0.00% | 0 |
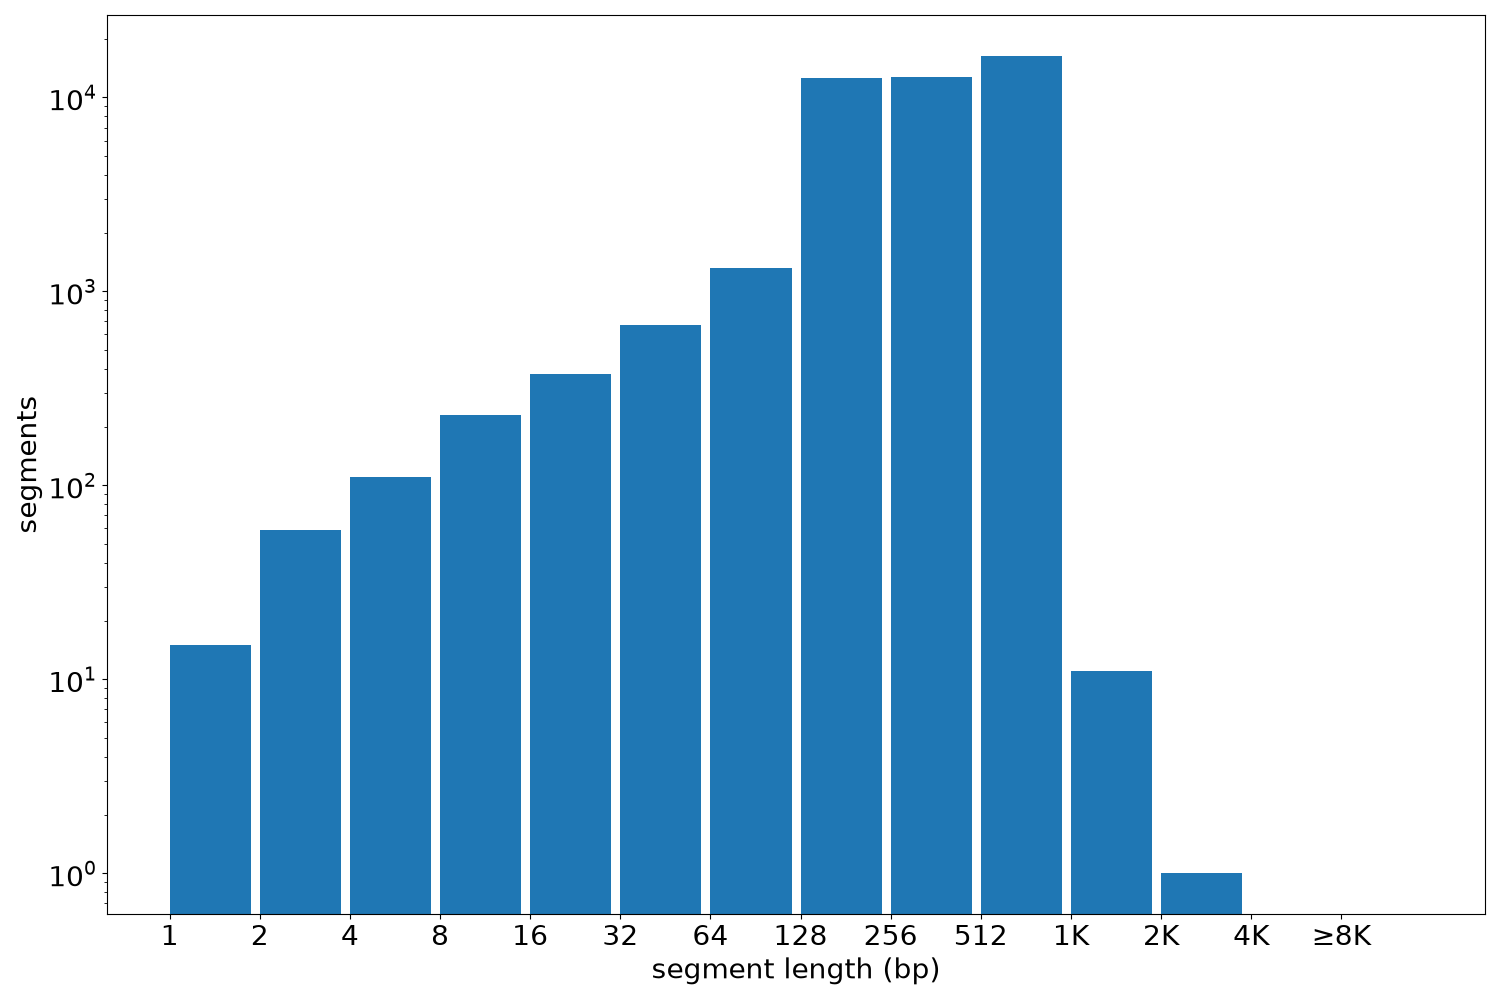
Segment lengths
| segments | min | max | mean | median | |
|---|---|---|---|---|---|
| segments | 44504 | 1 | 2348 | 375.99 | 362 |
Files
| Filename | Size | md5 |
|---|---|---|
| ENCFF628QJU.bed.gz | 625.79 KB | dc9ce027a41e9f4547f9aa222c71c62c |
| ENCFF628QJU.tabix.bed.gz | 510.98 KB | 9a3a00d3e882cb3fa4d8ae6392d27c72 |
| ENCFF628QJU.tabix.bed.gz.tbi | 176.95 KB | e2aaeee36b4b91d9073250da98d22717 |
| genomic_resource.yaml | 4.93 KB | 05944c02ce114bfb1119be9059fb22c3 |
| statistics/ |