Resource
| Id | TF_ChIP-seq/ENCSR000BQN |
|---|---|
| Type | position_score |
| Version | 0 |
| Summary | TF_ChIP-seq ENCSR000BQN [biosample_summary="Homo sapiens PFSK-1" and target="TAF1"] |
| Description |
status: released biological_replicates: Rep 1, Rep 2 summary: output_type: optimal IDR thresholded peaks audit_internal_action: Archived analysis {ENCAN253NNX|/analyses/ENCAN253NNX/} has in progress subobject quality standard {encode3-tf-chip|/quality-standards/encode3-tf-chip/} audit_not_compliant: Processed alignments file {ENCFF741GJT|/files/ENCFF741GJT/} processed by ChIP-seq ENCODE3 hg19 pipeline has 5010387 usable fragments. The minimum ENCODE standard for each replicate in a ChIP-seq experiment targeting TAF1-human and investigated as a transcription factor is 10 million usable fragments. The recommended value is > 20 million, but > 10 million is acceptable. (See {ENCODE ChIP-seq data standards|/data-standards/chip-seq/} ) audit_warning: Replicate concordance in ChIP-seq experiments is measured by calculating IDR values (Irreproducible Discovery Rate). ENCODE processed IDR thresholded peaks files {ENCFF070SAY|/files/ENCFF070SAY/}, {ENCFF750BVX|/files/ENCFF750BVX/} processed by ChIP-seq ENCODE3 hg19 pipeline have a rescue ratio of 1.34 and a self consistency ratio of 5.15. According to ENCODE standards, having both rescue ratio and self consistency ratio values < 2 is recommended, but having only one of the ratio values < 2 is acceptable. audit_warning: Replicate concordance in ChIP-seq experiments is measured by calculating IDR values (Irreproducible Discovery Rate). ENCODE processed IDR thresholded peaks files {ENCFF453DNJ|/files/ENCFF453DNJ/}, {ENCFF389PDP|/files/ENCFF389PDP/} processed by ChIP-seq ENCODE3 hg19 pipeline have a rescue ratio of 1.34 and a self consistency ratio of 5.15. According to ENCODE standards, having both rescue ratio and self consistency ratio values < 2 is recommended, but having only one of the ratio values < 2 is acceptable. |
| Labels |
|
Scores (1)
| ID | Type | Default annotation | Description | Histogram | Range | Summary |
|---|---|---|---|---|---|---|
| TF_ChIP-seq_ENCSR000BQN | float |
TF_ChIP-seq_ENCSR000BQN |
TF_ChIP-seq ENCSR000BQN [biosample_summary="Homo sapiens PFSK-1" and target="TAF1"]
|
 |
[7.27, 348] |
|
n counts base pairs; sd is the population standard deviation.
Coverage
| Chromosome | Covered positions | Covered % | Segments |
|---|---|---|---|
| all chromosomes | 6113635 | 0.19% | 18035 |
| chr1 | 638304 | 0.26% | 1900 |
| chr2 | 424618 | 0.18% | 1238 |
| chr3 | 232620 | 0.12% | 680 |
| chr4 | 256176 | 0.13% | 761 |
| chr5 | 306791 | 0.17% | 908 |
| chr6 | 461303 | 0.27% | 1380 |
| chr7 | 272096 | 0.17% | 813 |
| chr8 | 360710 | 0.25% | 1079 |
| chr9 | 192548 | 0.14% | 539 |
| chr10 | 231015 | 0.17% | 671 |
| chr11 | 443475 | 0.33% | 1345 |
| chr12 | 345684 | 0.26% | 1015 |
| chr13 | 67177 | 0.06% | 185 |
| chr14 | 97988 | 0.09% | 276 |
| chr15 | 207592 | 0.20% | 600 |
| chr16 | 199782 | 0.22% | 582 |
| chr17 | 415486 | 0.50% | 1262 |
| chr18 | 110084 | 0.14% | 324 |
| chr19 | 404131 | 0.69% | 1195 |
| chr20 | 158138 | 0.25% | 448 |
| chr21 | 65571 | 0.14% | 192 |
| chr22 | 100343 | 0.20% | 287 |
| chrX | 121131 | 0.08% | 353 |
| chrY | 872 | <0.01% | 2 |
| 3342 contigs with no values (129077085 bp) | 0 | 0.00% | 0 |
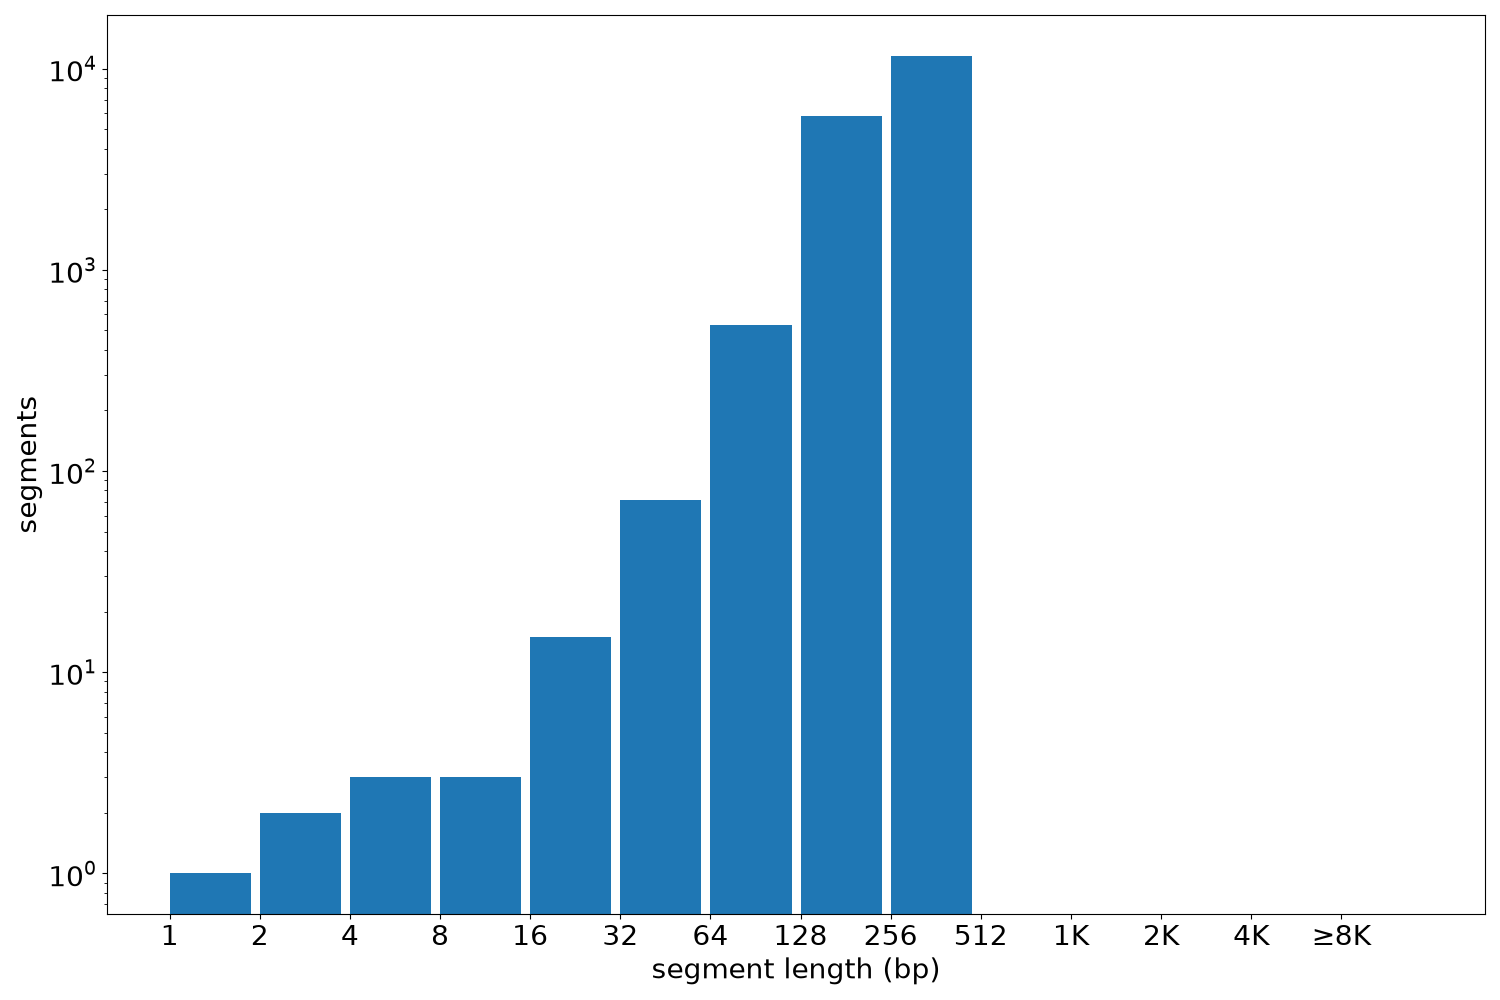
Segment lengths
| segments | min | max | mean | median | |
|---|---|---|---|---|---|
| segments | 18035 | 1 | 436 | 338.99 | 436 |
Files
| Filename | Size | md5 |
|---|---|---|
| ENCFF070SAY.bed.gz | 270.51 KB | 1a8073f1f951fdd5f174cb43a8608abf |
| ENCFF070SAY.tabix.bed.gz | 207.89 KB | 01eaa03f88d084c7caaceec97fc607a3 |
| ENCFF070SAY.tabix.bed.gz.tbi | 97.68 KB | dd1d9a03bf2b361e07fbfde82c0ffb8f |
| genomic_resource.yaml | 2.98 KB | eb50e85c3b2bf264b1cf9ee0528dd495 |
| statistics/ |