Resource
| Id | TF_ChIP-seq/ENCSR000BLT |
|---|---|
| Type | position_score |
| Version | 0 |
| Summary | TF_ChIP-seq ENCSR000BLT [biosample_summary="Homo sapiens GM12892" and target="YY1"] |
| Description |
status: released biological_replicates: Rep 1, Rep 2 summary: output_type: optimal IDR thresholded peaks audit_internal_action: File {ENCFF072IHJ|/files/ENCFF072IHJ/} with status 'released' is derived from file {ENCFF419RSJ|/files/ENCFF419RSJ/} with status 'archived'. audit_internal_action: Archived analysis {ENCAN734JTE|/analyses/ENCAN734JTE/} has in progress subobject quality standard {encode3-tf-chip|/quality-standards/encode3-tf-chip/} audit_warning: Processed alignments file {ENCFF981GSU|/files/ENCFF981GSU/} processed by ChIP-seq ENCODE3 GRCh38 pipeline has 11924299 usable fragments. The minimum ENCODE standard for each replicate in a ChIP-seq experiment targeting YY1-human and investigated as a transcription factor is 10 million usable fragments. The recommended value is > 20 million, but > 10 million is acceptable. (See {ENCODE ChIP-seq data standards|/data-standards/chip-seq/} ) audit_warning: Processed alignments file {ENCFF627UME|/files/ENCFF627UME/} processed by ChIP-seq ENCODE3 GRCh38 pipeline has 19851654 usable fragments. The minimum ENCODE standard for each replicate in a ChIP-seq experiment targeting YY1-human and investigated as a transcription factor is 10 million usable fragments. The recommended value is > 20 million, but > 10 million is acceptable. (See {ENCODE ChIP-seq data standards|/data-standards/chip-seq/} ) audit_warning: PBC1 (PCR Bottlenecking Coefficient 1, M1/M_distinct) is the ratio of the number of genomic locations where exactly one read maps uniquely (M1) to the number of genomic locations where some reads map (M_distinct). A PBC1 value in the range 0 - 0.5 is severe bottlenecking, 0.5 - 0.8 is moderate bottlenecking, 0.8 - 0.9 is mild bottlenecking, and > 0.9 is no bottlenecking. PBC1 value > 0.9 is recommended, but > 0.8 is acceptable. ENCODE processed alignments file {ENCFF981GSU|/files/ENCFF981GSU/} processed by ChIP-seq ENCODE3 GRCh38 pipeline was generated from a library with PBC1 value of 0.88. audit_warning: PBC2 (PCR Bottlenecking Coefficient 2, M1/M2) is the ratio of the number of genomic locations where exactly one read maps uniquely (M1) to the number of genomic locations where two reads map uniquely (M2). A PBC2 value in the range 0 - 1 is severe bottlenecking, 1 - 3 is moderate bottlenecking, 3 - 10 is mild bottlenecking, > 10 is no bottlenecking. PBC2 value > 10 is recommended, but > 3 is acceptable. ENCODE processed alignments file {ENCFF981GSU|/files/ENCFF981GSU/} processed by ChIP-seq ENCODE3 GRCh38 pipeline was generated from a library with PBC2 value of 9.75. audit_warning: PBC1 (PCR Bottlenecking Coefficient 1, M1/M_distinct) is the ratio of the number of genomic locations where exactly one read maps uniquely (M1) to the number of genomic locations where some reads map (M_distinct). A PBC1 value in the range 0 - 0.5 is severe bottlenecking, 0.5 - 0.8 is moderate bottlenecking, 0.8 - 0.9 is mild bottlenecking, and > 0.9 is no bottlenecking. PBC1 value > 0.9 is recommended, but > 0.8 is acceptable. ENCODE processed alignments file {ENCFF627UME|/files/ENCFF627UME/} processed by ChIP-seq ENCODE3 GRCh38 pipeline was generated from a library with PBC1 value of 0.85. audit_warning: PBC2 (PCR Bottlenecking Coefficient 2, M1/M2) is the ratio of the number of genomic locations where exactly one read maps uniquely (M1) to the number of genomic locations where two reads map uniquely (M2). A PBC2 value in the range 0 - 1 is severe bottlenecking, 1 - 3 is moderate bottlenecking, 3 - 10 is mild bottlenecking, > 10 is no bottlenecking. PBC2 value > 10 is recommended, but > 3 is acceptable. ENCODE processed alignments file {ENCFF627UME|/files/ENCFF627UME/} processed by ChIP-seq ENCODE3 GRCh38 pipeline was generated from a library with PBC2 value of 6.47. |
| Labels |
|
Scores (1)
| ID | Type | Default annotation | Description | Histogram | Range | Summary |
|---|---|---|---|---|---|---|
| TF_ChIP-seq_ENCSR000BLT | float |
TF_ChIP-seq_ENCSR000BLT |
TF_ChIP-seq ENCSR000BLT [biosample_summary="Homo sapiens GM12892" and target="YY1"]
|
 |
[4.73, 483] |
|
n counts base pairs; sd is the population standard deviation.
Coverage
| Chromosome | Covered positions | Covered % | Segments |
|---|---|---|---|
| all chromosomes | 6023024 | 0.19% | 21705 |
| chr1 | 603929 | 0.24% | 2141 |
| chr1_KI270713v1_random | 320 | 0.79% | 1 |
| chr2 | 427249 | 0.18% | 1516 |
| chr3 | 352838 | 0.18% | 1279 |
| chr4 | 202086 | 0.11% | 728 |
| chr5 | 300628 | 0.17% | 1080 |
| chr6 | 375437 | 0.22% | 1366 |
| chr7 | 271661 | 0.17% | 960 |
| chr8 | 216938 | 0.15% | 767 |
| chr9 | 235979 | 0.17% | 859 |
| chr10 | 261479 | 0.20% | 939 |
| chr11 | 322887 | 0.24% | 1161 |
| chr12 | 315641 | 0.24% | 1136 |
| chr13 | 126843 | 0.11% | 465 |
| chr14 | 198412 | 0.19% | 702 |
| chr15 | 193440 | 0.19% | 711 |
| chr16 | 248624 | 0.28% | 881 |
| chr17 | 339367 | 0.41% | 1233 |
| chr17_GL000205v2_random | 1059 | 0.57% | 6 |
| chr18 | 101313 | 0.13% | 364 |
| chr19 | 359101 | 0.61% | 1306 |
| chr20 | 160111 | 0.25% | 583 |
| chr21 | 57003 | 0.12% | 208 |
| chr22 | 129169 | 0.25% | 469 |
| chrEBV | 63852 | 37.16% | 262 |
| chrM | 7496 | 45.24% | 36 |
| chrUn_KI270467v1 | 640 | 16.33% | 2 |
| chrX | 149522 | 0.10% | 544 |
| 3338 contigs with no values (185885852 bp) | 0 | 0.00% | 0 |
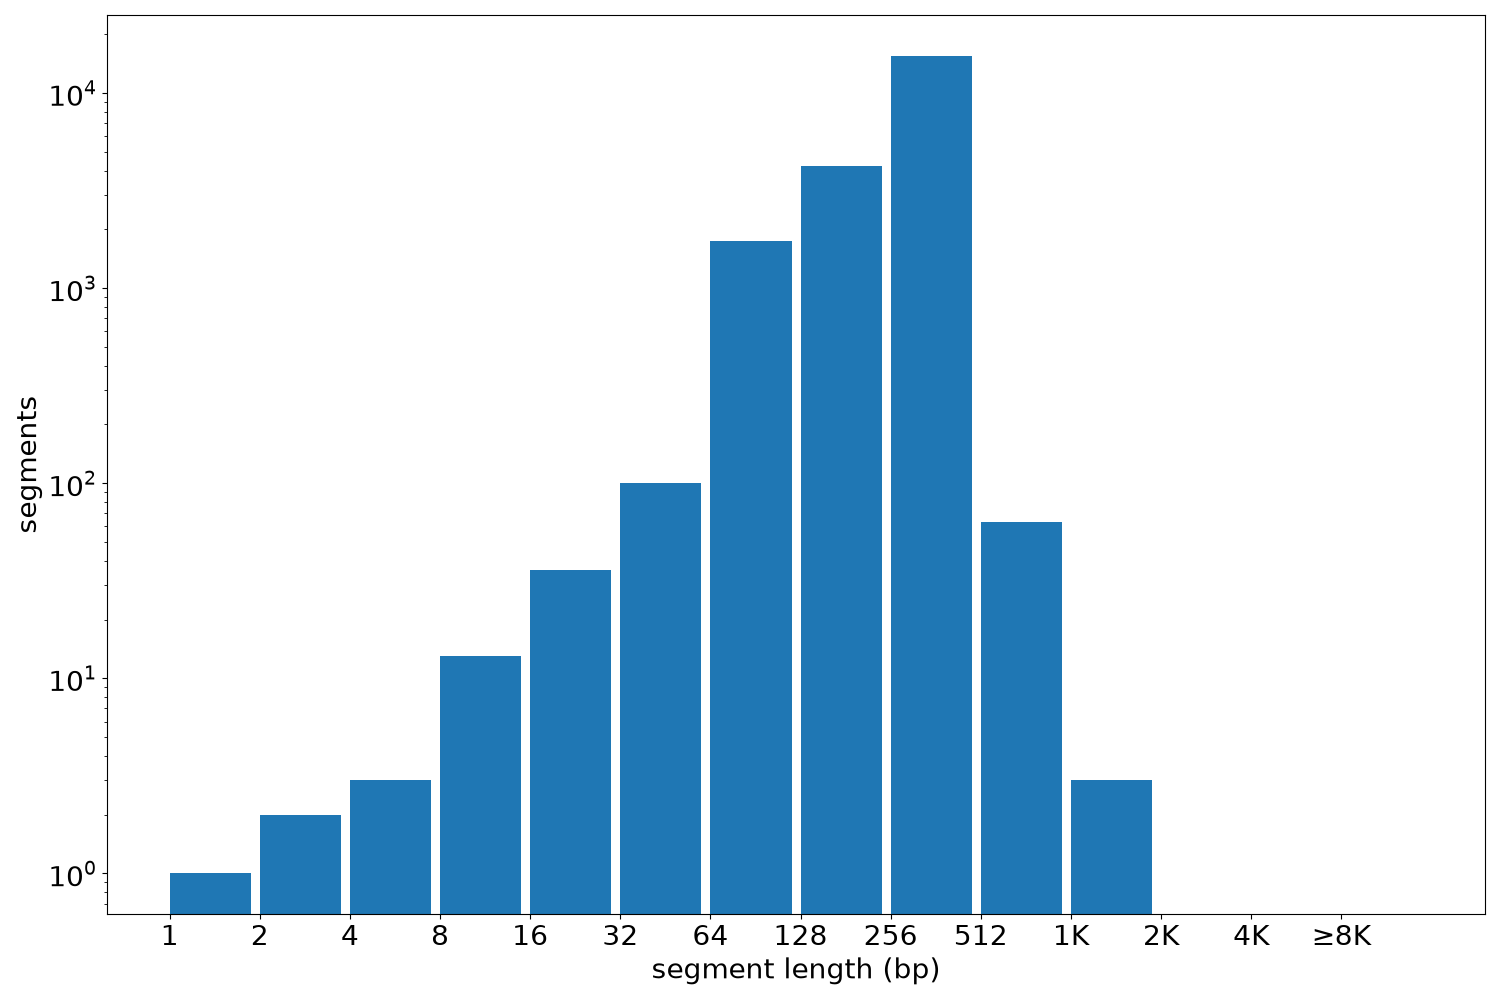
Segment lengths
| segments | min | max | mean | median | |
|---|---|---|---|---|---|
| segments | 21705 | 1 | 1495 | 277.49 | 320 |
Files
| Filename | Size | md5 |
|---|---|---|
| ENCFF072IHJ.bed.gz | 346.84 KB | 6fa9471ae4d4ed4de71b3172b83c4efa |
| ENCFF072IHJ.tabix.bed.gz | 252.39 KB | 8a7817af26d771f42e3c1d06d1a2711b |
| ENCFF072IHJ.tabix.bed.gz.tbi | 129.49 KB | 772b10db10d1e10c3fdc39dc7094244c |
| genomic_resource.yaml | 5.12 KB | c700a1355ff577c1a26390f600559070 |
| statistics/ |