Resource
| Id | TF_ChIP-seq/ENCSR000BIF |
|---|---|
| Type | position_score |
| Version | 0 |
| Summary | TF_ChIP-seq ENCSR000BIF [biosample_summary="Homo sapiens GM12878" and target="POLR2AphosphoS5"] |
| Description |
status: released biological_replicates: Rep 1, Rep 2 summary: output_type: IDR thresholded peaks audit_internal_action: Released analysis {ENCAN307JIY|/analyses/ENCAN307JIY/} has in progress subobject document {f0815640-fdb3-48a8-a4a2-0341a1ae1930|/documents/f0815640-fdb3-48a8-a4a2-0341a1ae1930/} audit_internal_action: Released analysis {ENCAN307JIY|/analyses/ENCAN307JIY/} has in progress subobject quality standard {encode4-tf-chip|/quality-standards/encode4-tf-chip/} audit_warning: PBC1 (PCR Bottlenecking Coefficient 1, M1/M_distinct) is the ratio of the number of genomic locations where exactly one read maps uniquely (M1) to the number of genomic locations where some reads map (M_distinct). A PBC1 value in the range 0 - 0.5 is severe bottlenecking, 0.5 - 0.8 is moderate bottlenecking, 0.8 - 0.9 is mild bottlenecking, and > 0.9 is no bottlenecking. PBC1 value > 0.9 is recommended, but > 0.8 is acceptable. ENCODE processed alignments file {ENCFF521NGV|/files/ENCFF521NGV/} processed by ChIP-seq ENCODE4 v1.6.1 GRCh38 pipeline was generated from a library with PBC1 value of 0.83. audit_warning: PBC2 (PCR Bottlenecking Coefficient 2, M1/M2) is the ratio of the number of genomic locations where exactly one read maps uniquely (M1) to the number of genomic locations where two reads map uniquely (M2). A PBC2 value in the range 0 - 1 is severe bottlenecking, 1 - 3 is moderate bottlenecking, 3 - 10 is mild bottlenecking, > 10 is no bottlenecking. PBC2 value > 10 is recommended, but > 3 is acceptable. ENCODE processed alignments file {ENCFF521NGV|/files/ENCFF521NGV/} processed by ChIP-seq ENCODE4 v1.6.1 GRCh38 pipeline was generated from a library with PBC2 value of 5.90. |
| Labels |
|
Scores (1)
| ID | Type | Default annotation | Description | Histogram | Range | Summary |
|---|---|---|---|---|---|---|
| TF_ChIP-seq_ENCSR000BIF | float |
TF_ChIP-seq_ENCSR000BIF |
TF_ChIP-seq ENCSR000BIF [biosample_summary="Homo sapiens GM12878" and target="POLR2AphosphoS5"]
|
 |
[8.64, 652] |
|
n counts base pairs; sd is the population standard deviation.
Coverage
| Chromosome | Covered positions | Covered % | Segments |
|---|---|---|---|
| all chromosomes | 16599744 | 0.52% | 30941 |
| chr1 | 1635243 | 0.66% | 2964 |
| chr2 | 1165827 | 0.48% | 2205 |
| chr3 | 913706 | 0.46% | 1758 |
| chr4 | 552974 | 0.29% | 1085 |
| chr5 | 813880 | 0.45% | 1532 |
| chr6 | 1095828 | 0.64% | 1859 |
| chr7 | 722763 | 0.45% | 1409 |
| chr8 | 587664 | 0.40% | 1176 |
| chr9 | 642929 | 0.46% | 1295 |
| chr10 | 671347 | 0.50% | 1281 |
| chr11 | 846306 | 0.63% | 1544 |
| chr12 | 934962 | 0.70% | 1722 |
| chr13 | 280545 | 0.25% | 566 |
| chr14 | 620790 | 0.58% | 1070 |
| chr15 | 525509 | 0.52% | 940 |
| chr16 | 711421 | 0.79% | 1388 |
| chr17 | 1060227 | 1.27% | 1897 |
| chr18 | 233217 | 0.29% | 458 |
| chr19 | 1158280 | 1.98% | 2062 |
| chr20 | 447421 | 0.69% | 870 |
| chr21 | 217488 | 0.47% | 361 |
| chr22 | 416270 | 0.82% | 784 |
| chrX | 345147 | 0.22% | 715 |
| 3343 contigs with no values (186304500 bp) | 0 | 0.00% | 0 |
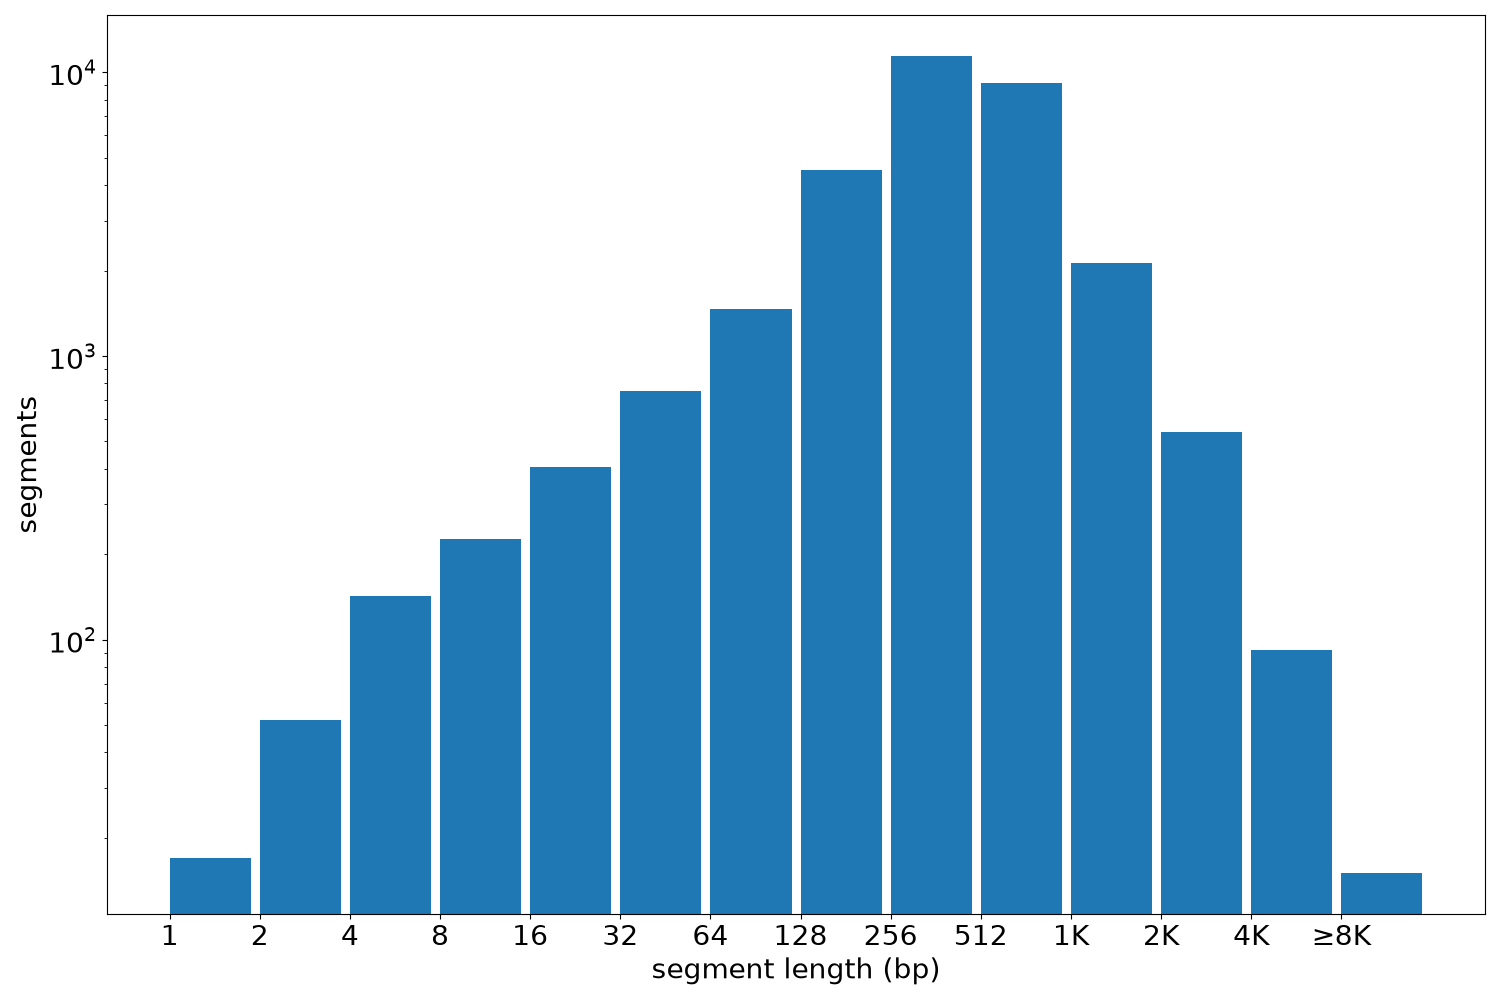
Segment lengths
| segments | min | max | mean | median | |
|---|---|---|---|---|---|
| segments | 30941 | 1 | 16419 | 536.5 | 418 |
Files
| Filename | Size | md5 |
|---|---|---|
| ENCFF107UMF.bed.gz | 633.08 KB | 566c729848b6eac01970cbb117259986 |
| ENCFF107UMF.tabix.bed.gz | 364.35 KB | 467ecd0459d9cd09ad537c140823e138 |
| ENCFF107UMF.tabix.bed.gz.tbi | 120.31 KB | 0910679cb48fefe840d1fd7fc6f45277 |
| genomic_resource.yaml | 2.91 KB | b1efb644b9c1882352a1a49da3e40006 |
| statistics/ |