Resource
| Id | TF_ChIP-seq/ENCSR000BGK |
|---|---|
| Type | position_score |
| Version | 0 |
| Summary | TF_ChIP-seq ENCSR000BGK [biosample_summary="Homo sapiens HepG2" and target="JUND"] |
| Description |
status: released biological_replicates: Rep 1, Rep 2 summary: output_type: optimal IDR thresholded peaks audit_internal_action: Archived analysis {ENCAN566JND|/analyses/ENCAN566JND/} has in progress subobject quality standard {encode3-tf-chip|/quality-standards/encode3-tf-chip/} audit_warning: Processed alignments file {ENCFF776GGM|/files/ENCFF776GGM/} processed by ChIP-seq ENCODE3 hg19 pipeline has 11210059 usable fragments. The minimum ENCODE standard for each replicate in a ChIP-seq experiment targeting JUND-human and investigated as a transcription factor is 10 million usable fragments. The recommended value is > 20 million, but > 10 million is acceptable. (See {ENCODE ChIP-seq data standards|/data-standards/chip-seq/} ) audit_warning: Replicate concordance in ChIP-seq experiments is measured by calculating IDR values (Irreproducible Discovery Rate). ENCODE processed IDR thresholded peaks files {ENCFF886LBC|/files/ENCFF886LBC/}, {ENCFF938YQW|/files/ENCFF938YQW/} processed by ChIP-seq ENCODE3 hg19 pipeline have a rescue ratio of 1.07 and a self consistency ratio of 2.34. According to ENCODE standards, having both rescue ratio and self consistency ratio values < 2 is recommended, but having only one of the ratio values < 2 is acceptable. audit_warning: Replicate concordance in ChIP-seq experiments is measured by calculating IDR values (Irreproducible Discovery Rate). ENCODE processed IDR thresholded peaks files {ENCFF971UIP|/files/ENCFF971UIP/}, {ENCFF721HUX|/files/ENCFF721HUX/} processed by ChIP-seq ENCODE3 hg19 pipeline have a rescue ratio of 1.07 and a self consistency ratio of 2.34. According to ENCODE standards, having both rescue ratio and self consistency ratio values < 2 is recommended, but having only one of the ratio values < 2 is acceptable. |
| Labels |
|
Scores (1)
| ID | Type | Default annotation | Description | Histogram | Range | Summary |
|---|---|---|---|---|---|---|
| TF_ChIP-seq_ENCSR000BGK | float |
TF_ChIP-seq_ENCSR000BGK |
TF_ChIP-seq ENCSR000BGK [biosample_summary="Homo sapiens HepG2" and target="JUND"]
|
 |
[5.39, 396] |
|
n counts base pairs; sd is the population standard deviation.
Coverage
| Chromosome | Covered positions | Covered % | Segments |
|---|---|---|---|
| all chromosomes | 6683336 | 0.21% | 27217 |
| chr1 | 582852 | 0.23% | 2372 |
| chr2 | 693995 | 0.29% | 2838 |
| chr3 | 378562 | 0.19% | 1538 |
| chr4 | 204861 | 0.11% | 832 |
| chr5 | 270848 | 0.15% | 1105 |
| chr6 | 477505 | 0.28% | 1944 |
| chr7 | 281797 | 0.18% | 1154 |
| chr8 | 256327 | 0.18% | 1037 |
| chr9 | 252519 | 0.18% | 1026 |
| chr10 | 274490 | 0.21% | 1110 |
| chr11 | 300013 | 0.22% | 1223 |
| chr12 | 283619 | 0.21% | 1151 |
| chr13 | 115595 | 0.10% | 462 |
| chr14 | 245318 | 0.23% | 999 |
| chr15 | 168767 | 0.17% | 690 |
| chr16 | 366336 | 0.41% | 1494 |
| chr17 | 456452 | 0.55% | 1875 |
| chr18 | 116499 | 0.14% | 469 |
| chr19 | 288538 | 0.49% | 1175 |
| chr20 | 347510 | 0.54% | 1431 |
| chr21 | 82822 | 0.18% | 330 |
| chr22 | 155443 | 0.31% | 630 |
| chrX | 81900 | 0.05% | 329 |
| chrY | 768 | <0.01% | 3 |
| 3342 contigs with no values (129077085 bp) | 0 | 0.00% | 0 |
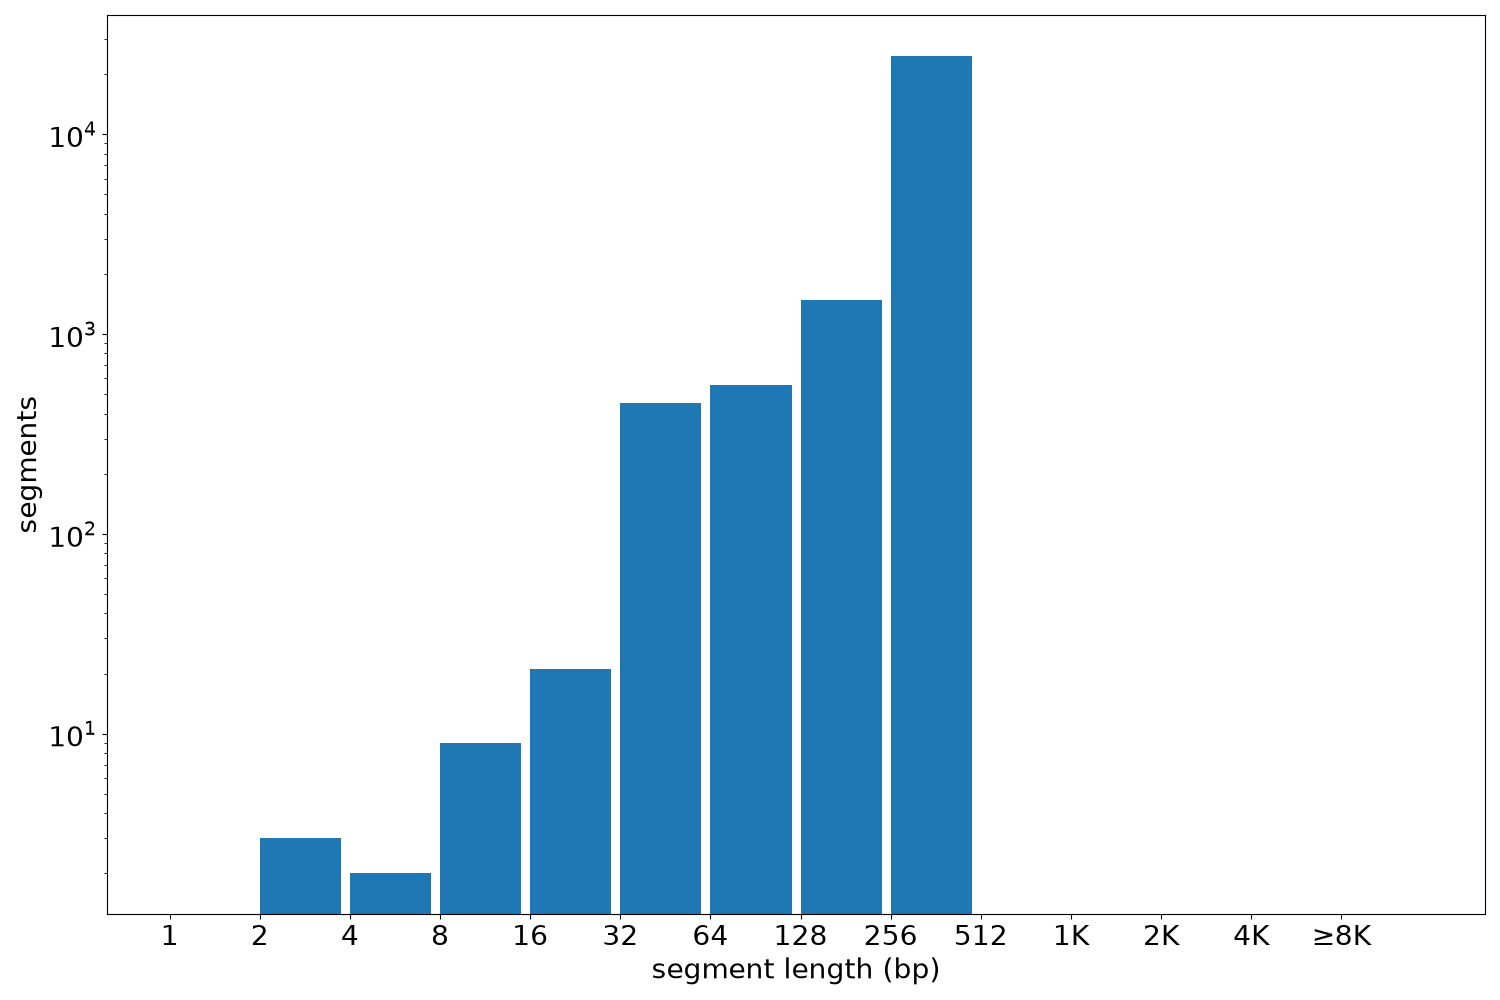
Segment lengths
| segments | min | max | mean | median | |
|---|---|---|---|---|---|
| segments | 27217 | 2 | 332 | 245.56 | 256 |
Files
| Filename | Size | md5 |
|---|---|---|
| ENCFF721HUX.bed.gz | 469.52 KB | 52a019c14919da9374985ab812f42e9d |
| ENCFF721HUX.tabix.bed.gz | 313.56 KB | 541c203ca493af3e30e755a583a0bc01 |
| ENCFF721HUX.tabix.bed.gz.tbi | 158.01 KB | 519c0065a06fc848f4c6fed7a2dc33f0 |
| genomic_resource.yaml | 2.97 KB | 661d10401629db94dbf6269c97ba7a6f |
| statistics/ |