Resource
| Id | TF_ChIP-seq/ENCSR000AMF |
|---|---|
| Type | position_score |
| Version | 0 |
| Summary | TF_ChIP-seq ENCSR000AMF [biosample_summary="Homo sapiens H1" and target="CTCF"] |
| Description |
status: released biological_replicates: Rep 1 summary: output_type: pseudoreplicated IDR thresholded peaks audit_internal_action: Archived analysis {ENCAN131JVJ|/analyses/ENCAN131JVJ/} has in progress subobject quality standard {encode3-tf-chip|/quality-standards/encode3-tf-chip/} audit_warning: Processed alignments file {ENCFF391MCN|/files/ENCFF391MCN/} processed by ChIP-seq ENCODE3 hg19 pipeline has 19866604 usable fragments. The minimum ENCODE standard for each replicate in a ChIP-seq experiment targeting CTCF-human and investigated as a transcription factor is 10 million usable fragments. The recommended value is > 20 million, but > 10 million is acceptable. (See {ENCODE ChIP-seq data standards|/data-standards/chip-seq/} ) audit_warning: PBC1 (PCR Bottlenecking Coefficient 1, M1/M_distinct) is the ratio of the number of genomic locations where exactly one read maps uniquely (M1) to the number of genomic locations where some reads map (M_distinct). A PBC1 value in the range 0 - 0.5 is severe bottlenecking, 0.5 - 0.8 is moderate bottlenecking, 0.8 - 0.9 is mild bottlenecking, and > 0.9 is no bottlenecking. PBC1 value > 0.9 is recommended, but > 0.8 is acceptable. ENCODE processed alignments file {ENCFF391MCN|/files/ENCFF391MCN/} processed by ChIP-seq ENCODE3 hg19 pipeline was generated from a library with PBC1 value of 0.86. audit_warning: PBC2 (PCR Bottlenecking Coefficient 2, M1/M2) is the ratio of the number of genomic locations where exactly one read maps uniquely (M1) to the number of genomic locations where two reads map uniquely (M2). A PBC2 value in the range 0 - 1 is severe bottlenecking, 1 - 3 is moderate bottlenecking, 3 - 10 is mild bottlenecking, > 10 is no bottlenecking. PBC2 value > 10 is recommended, but > 3 is acceptable. ENCODE processed alignments file {ENCFF391MCN|/files/ENCFF391MCN/} processed by ChIP-seq ENCODE3 hg19 pipeline was generated from a library with PBC2 value of 8.02. |
| Labels |
|
Scores (1)
| ID | Type | Default annotation | Description | Histogram | Range | Summary |
|---|---|---|---|---|---|---|
| TF_ChIP-seq_ENCSR000AMF | float |
TF_ChIP-seq_ENCSR000AMF |
TF_ChIP-seq ENCSR000AMF [biosample_summary="Homo sapiens H1" and target="CTCF"]
|
 |
[3.16, 289] |
|
n counts base pairs; sd is the population standard deviation.
Coverage
| Chromosome | Covered positions | Covered % | Segments |
|---|---|---|---|
| all chromosomes | 15730490 | 0.49% | 68464 |
| chr1 | 1422458 | 0.57% | 6203 |
| chr2 | 1244805 | 0.51% | 5387 |
| chr3 | 1000368 | 0.50% | 4350 |
| chr4 | 794969 | 0.42% | 3405 |
| chr5 | 872548 | 0.48% | 3791 |
| chr6 | 865727 | 0.51% | 3787 |
| chr7 | 808014 | 0.51% | 3493 |
| chr8 | 717560 | 0.49% | 3131 |
| chr9 | 656521 | 0.47% | 2857 |
| chr10 | 746902 | 0.56% | 3248 |
| chr11 | 826272 | 0.61% | 3657 |
| chr12 | 763045 | 0.57% | 3339 |
| chr13 | 410667 | 0.36% | 1755 |
| chr14 | 513480 | 0.48% | 2234 |
| chr15 | 512126 | 0.50% | 2248 |
| chr16 | 548230 | 0.61% | 2387 |
| chr17 | 652693 | 0.78% | 2894 |
| chr18 | 363497 | 0.45% | 1578 |
| chr19 | 545355 | 0.93% | 2434 |
| chr20 | 442956 | 0.69% | 1945 |
| chr21 | 187601 | 0.40% | 807 |
| chr22 | 326201 | 0.64% | 1431 |
| chrX | 494287 | 0.32% | 2048 |
| chrY | 14208 | 0.02% | 55 |
| 3342 contigs with no values (129077085 bp) | 0 | 0.00% | 0 |
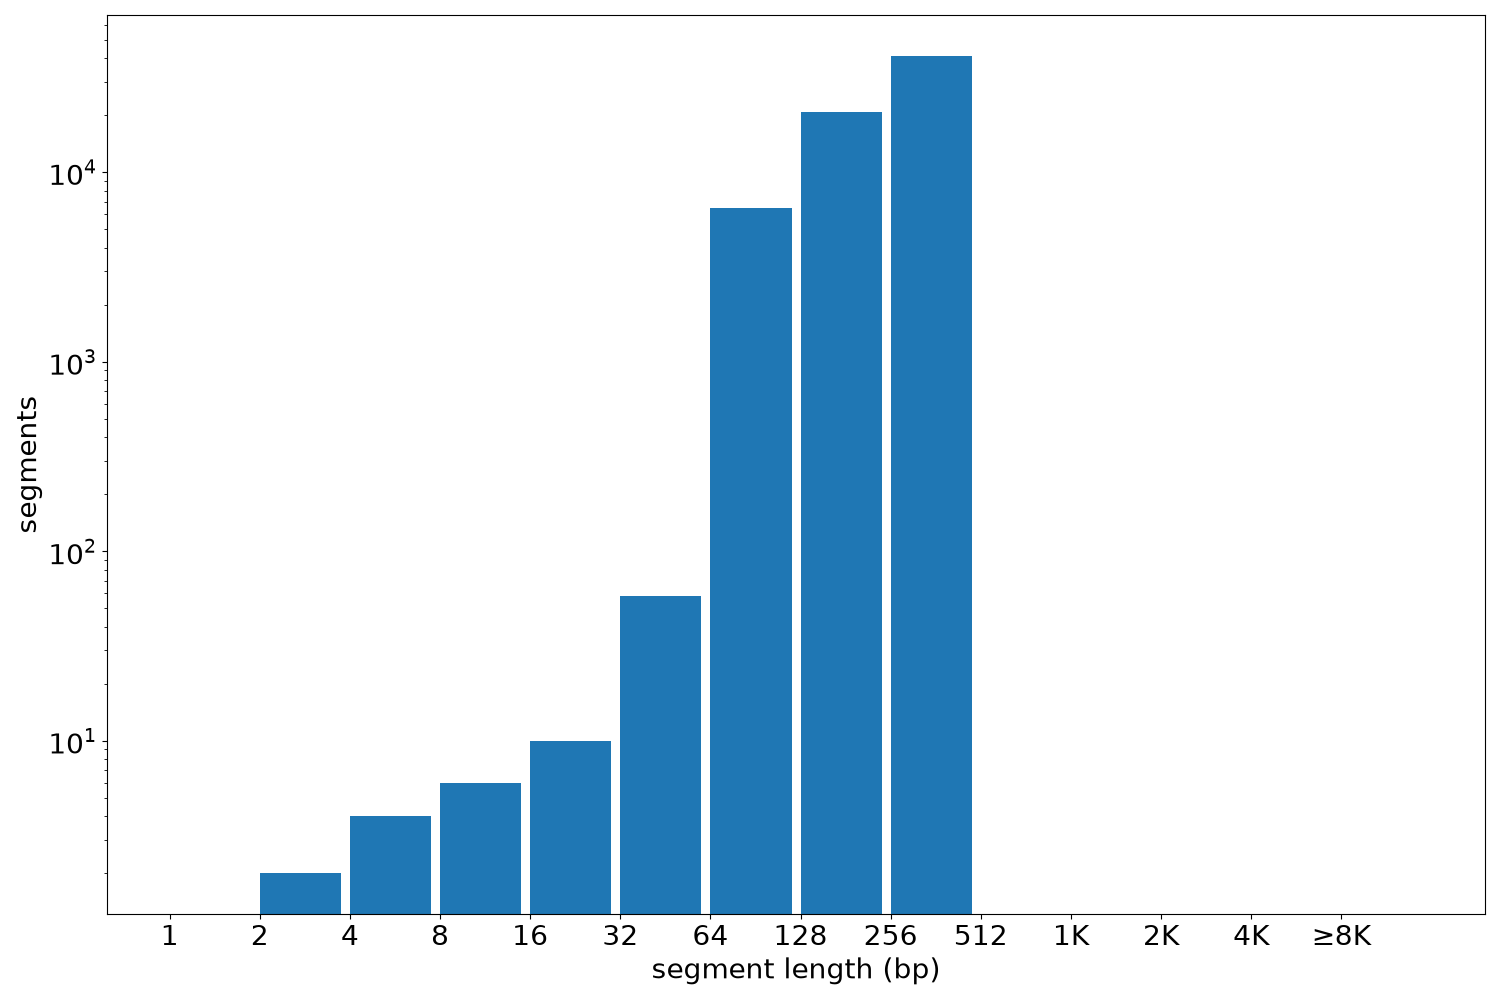
Segment lengths
| segments | min | max | mean | median | |
|---|---|---|---|---|---|
| segments | 68464 | 2 | 424 | 229.76 | 276 |
Files
| Filename | Size | md5 |
|---|---|---|
| ENCFF093VEE.bed.gz | 1.01 MB | 4bf159bd7c7771fc8890a7a55a989001 |
| ENCFF093VEE.tabix.bed.gz | 794.49 KB | 73d5004b17bc82b343abfa0e06613fcf |
| ENCFF093VEE.tabix.bed.gz.tbi | 395.44 KB | b34c755cd581aed77cc61855b835e9d0 |
| genomic_resource.yaml | 3.13 KB | fe345b713f0c43803dee4f34e74282c9 |
| statistics/ |