Resource
| Id | TF_ChIP-seq/ENCSR000AHD |
|---|---|
| Type | position_score |
| Version | 0 |
| Summary | TF_ChIP-seq ENCSR000AHD [biosample_summary="Homo sapiens MCF-7" and target="CTCF"] |
| Description |
status: released biological_replicates: Rep 1, Rep 2 summary: output_type: optimal IDR thresholded peaks audit_internal_action: Archived analysis {ENCAN217XPR|/analyses/ENCAN217XPR/} has in progress subobject quality standard {encode3-tf-chip|/quality-standards/encode3-tf-chip/} audit_warning: Processed alignments file {ENCFF335UKS|/files/ENCFF335UKS/} processed by ChIP-seq ENCODE3 hg19 pipeline has 14296383 usable fragments. The minimum ENCODE standard for each replicate in a ChIP-seq experiment targeting CTCF-human and investigated as a transcription factor is 10 million usable fragments. The recommended value is > 20 million, but > 10 million is acceptable. (See {ENCODE ChIP-seq data standards|/data-standards/chip-seq/} ) audit_warning: PBC1 (PCR Bottlenecking Coefficient 1, M1/M_distinct) is the ratio of the number of genomic locations where exactly one read maps uniquely (M1) to the number of genomic locations where some reads map (M_distinct). A PBC1 value in the range 0 - 0.5 is severe bottlenecking, 0.5 - 0.8 is moderate bottlenecking, 0.8 - 0.9 is mild bottlenecking, and > 0.9 is no bottlenecking. PBC1 value > 0.9 is recommended, but > 0.8 is acceptable. ENCODE processed alignments file {ENCFF335UKS|/files/ENCFF335UKS/} processed by ChIP-seq ENCODE3 hg19 pipeline was generated from a library with PBC1 value of 0.87. audit_warning: PBC2 (PCR Bottlenecking Coefficient 2, M1/M2) is the ratio of the number of genomic locations where exactly one read maps uniquely (M1) to the number of genomic locations where two reads map uniquely (M2). A PBC2 value in the range 0 - 1 is severe bottlenecking, 1 - 3 is moderate bottlenecking, 3 - 10 is mild bottlenecking, > 10 is no bottlenecking. PBC2 value > 10 is recommended, but > 3 is acceptable. ENCODE processed alignments file {ENCFF335UKS|/files/ENCFF335UKS/} processed by ChIP-seq ENCODE3 hg19 pipeline was generated from a library with PBC2 value of 7.84. |
| Labels |
|
Scores (1)
| ID | Type | Default annotation | Description | Histogram | Range | Summary |
|---|---|---|---|---|---|---|
| TF_ChIP-seq_ENCSR000AHD | float |
TF_ChIP-seq_ENCSR000AHD |
TF_ChIP-seq ENCSR000AHD [biosample_summary="Homo sapiens MCF-7" and target="CTCF"]
|
 |
[4.52, 647] |
|
n counts base pairs; sd is the population standard deviation.
Coverage
| Chromosome | Covered positions | Covered % | Segments |
|---|---|---|---|
| all chromosomes | 11625130 | 0.36% | 56306 |
| chr1 | 1007945 | 0.40% | 4878 |
| chr2 | 940134 | 0.39% | 4584 |
| chr3 | 748267 | 0.38% | 3670 |
| chr4 | 534512 | 0.28% | 2523 |
| chr5 | 683490 | 0.38% | 3330 |
| chr6 | 659194 | 0.39% | 3223 |
| chr7 | 620344 | 0.39% | 3043 |
| chr8 | 564938 | 0.39% | 2738 |
| chr9 | 488356 | 0.35% | 2378 |
| chr10 | 554810 | 0.41% | 2721 |
| chr11 | 550766 | 0.41% | 2653 |
| chr12 | 589678 | 0.44% | 2917 |
| chr13 | 267266 | 0.23% | 1224 |
| chr14 | 482913 | 0.45% | 2361 |
| chr15 | 379996 | 0.37% | 1852 |
| chr16 | 374948 | 0.42% | 1806 |
| chr17 | 492994 | 0.59% | 2392 |
| chr18 | 215280 | 0.27% | 1014 |
| chr19 | 334977 | 0.57% | 1647 |
| chr20 | 404460 | 0.63% | 1945 |
| chr21 | 139778 | 0.30% | 661 |
| chr22 | 187195 | 0.37% | 904 |
| chrX | 402889 | 0.26% | 1842 |
| 3343 contigs with no values (186304500 bp) | 0 | 0.00% | 0 |
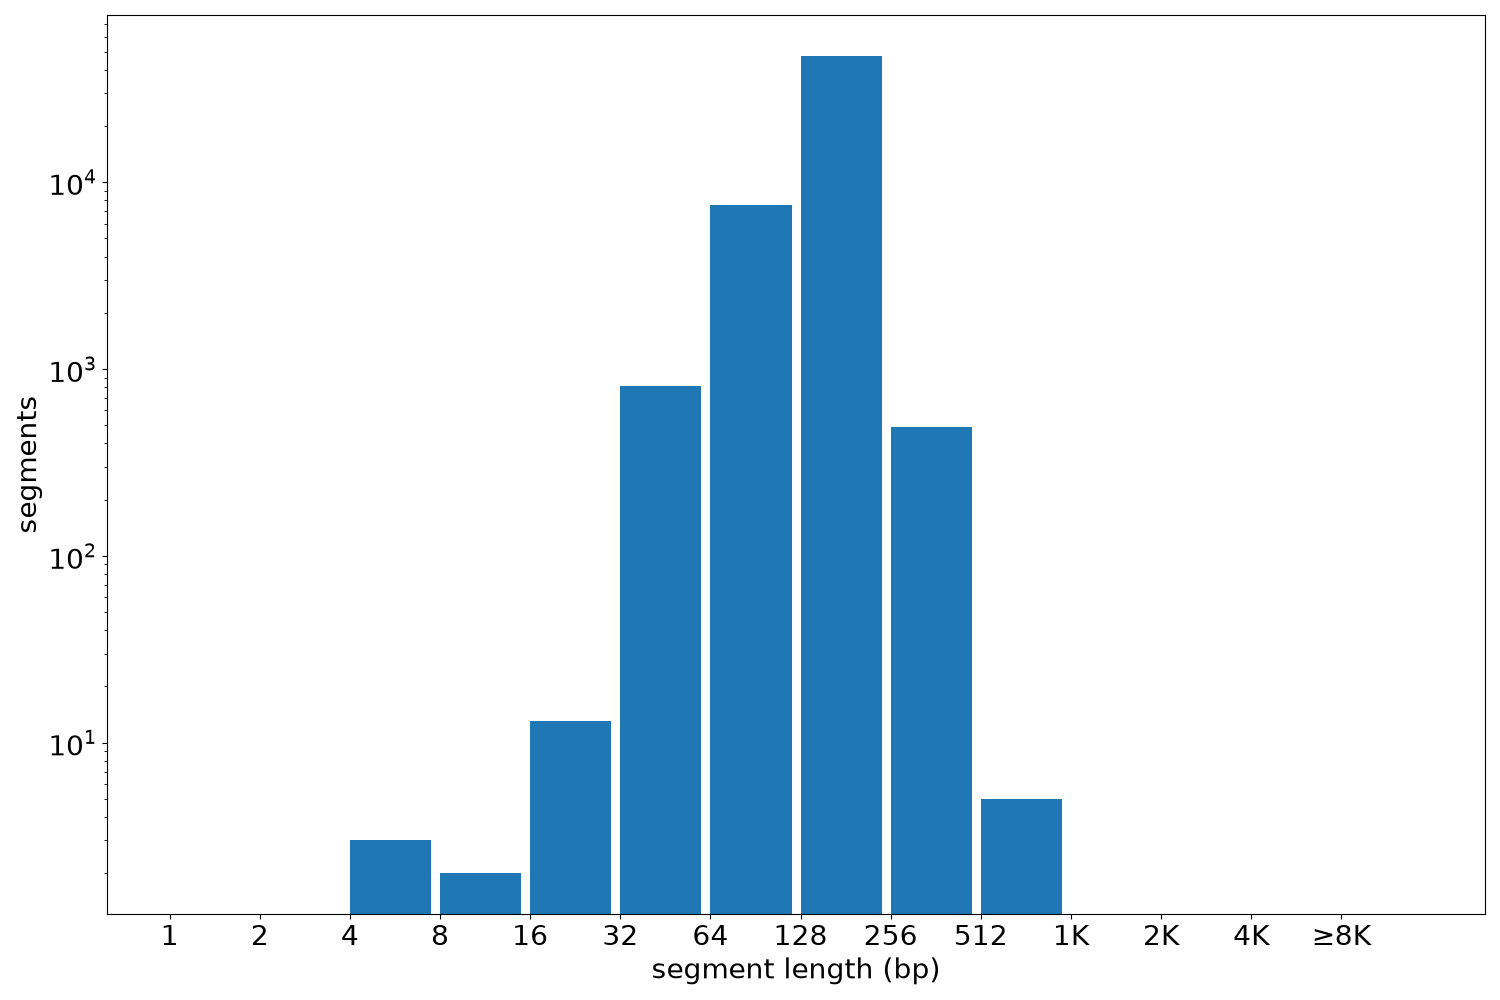
Segment lengths
| segments | min | max | mean | median | |
|---|---|---|---|---|---|
| segments | 56306 | 4 | 678 | 206.46 | 240 |
Files
| Filename | Size | md5 |
|---|---|---|
| ENCFF586KIH.bed.gz | 894.86 KB | 5a8e504b171a26058efc3a830eef1183 |
| ENCFF586KIH.tabix.bed.gz | 655.8 KB | 729b9a8c64dbc50558ae5eb012510f34 |
| ENCFF586KIH.tabix.bed.gz.tbi | 341.75 KB | 89dcd898f0f9616cea8f48718f1d169b |
| genomic_resource.yaml | 3.14 KB | d17a73b66037a0feb28650fbce3e904e |
| statistics/ |