Resource
| Id | Histone_ChIP-seq/ENCSR996GHD |
|---|---|
| Type | position_score |
| Version | 0 |
| Summary | Histone_ChIP-seq ENCSR996GHD [biosample_summary="Homo sapiens OCI-LY3" and target="H3K9ac"] |
| Description |
status: released biological_replicates: Rep 1, Rep 2 summary: output_type: replicated peaks audit_internal_action: Archived analysis {ENCAN297ONM|/analyses/ENCAN297ONM/} has in progress subobject quality standard {encode3-histone-chip|/quality-standards/encode3-histone-chip/} audit_warning: PBC1 (PCR Bottlenecking Coefficient 1, M1/M_distinct) is the ratio of the number of genomic locations where exactly one read maps uniquely (M1) to the number of genomic locations where some reads map (M_distinct). A PBC1 value in the range 0 - 0.5 is severe bottlenecking, 0.5 - 0.8 is moderate bottlenecking, 0.8 - 0.9 is mild bottlenecking, and > 0.9 is no bottlenecking. PBC1 value > 0.9 is recommended, but > 0.8 is acceptable. ENCODE processed alignments file {ENCFF145MQT|/files/ENCFF145MQT/} processed by ChIP-seq ENCODE3 hg19 pipeline was generated from a library with PBC1 value of 0.87. audit_warning: PBC2 (PCR Bottlenecking Coefficient 2, M1/M2) is the ratio of the number of genomic locations where exactly one read maps uniquely (M1) to the number of genomic locations where two reads map uniquely (M2). A PBC2 value in the range 0 - 1 is severe bottlenecking, 1 - 3 is moderate bottlenecking, 3 - 10 is mild bottlenecking, > 10 is no bottlenecking. PBC2 value > 10 is recommended, but > 3 is acceptable. ENCODE processed alignments file {ENCFF145MQT|/files/ENCFF145MQT/} processed by ChIP-seq ENCODE3 hg19 pipeline was generated from a library with PBC2 value of 7.69. |
| Labels |
|
Scores (1)
| ID | Type | Default annotation | Description | Histogram | Range | Summary |
|---|---|---|---|---|---|---|
| Histone_ChIP-seq_ENCSR996GHD | float |
Histone_ChIP-seq_ENCSR996GHD |
Histone_ChIP-seq ENCSR996GHD [biosample_summary="Homo sapiens OCI-LY3" and target="H3K9ac"]
|
 |
[1.6, 57] |
|
n counts base pairs; sd is the population standard deviation.
Coverage
| Chromosome | Covered positions | Covered % | Segments |
|---|---|---|---|
| all chromosomes | 56794240 | 1.77% | 53216 |
| chr1 | 5642873 | 2.27% | 5165 |
| chr2 | 4142971 | 1.71% | 3948 |
| chr3 | 3642699 | 1.84% | 3437 |
| chr4 | 2343017 | 1.23% | 2304 |
| chr5 | 2612925 | 1.44% | 2461 |
| chr6 | 3512101 | 2.06% | 3264 |
| chr7 | 2711245 | 1.70% | 2572 |
| chr8 | 2259712 | 1.56% | 2102 |
| chr9 | 2150563 | 1.55% | 2001 |
| chr10 | 2109538 | 1.58% | 2110 |
| chr11 | 3068431 | 2.27% | 2789 |
| chr12 | 3195397 | 2.40% | 2890 |
| chr13 | 1276631 | 1.12% | 1250 |
| chr14 | 1937712 | 1.81% | 1840 |
| chr15 | 1950233 | 1.91% | 1744 |
| chr16 | 1963036 | 2.17% | 1872 |
| chr17 | 2895811 | 3.48% | 2662 |
| chr18 | 1414759 | 1.76% | 1281 |
| chr19 | 2604401 | 4.44% | 2422 |
| chr20 | 1561213 | 2.42% | 1472 |
| chr21 | 603976 | 1.29% | 576 |
| chr22 | 1275349 | 2.51% | 1163 |
| chrX | 1803592 | 1.16% | 1779 |
| chrY | 116055 | 0.20% | 112 |
| 3342 contigs with no values (129077085 bp) | 0 | 0.00% | 0 |
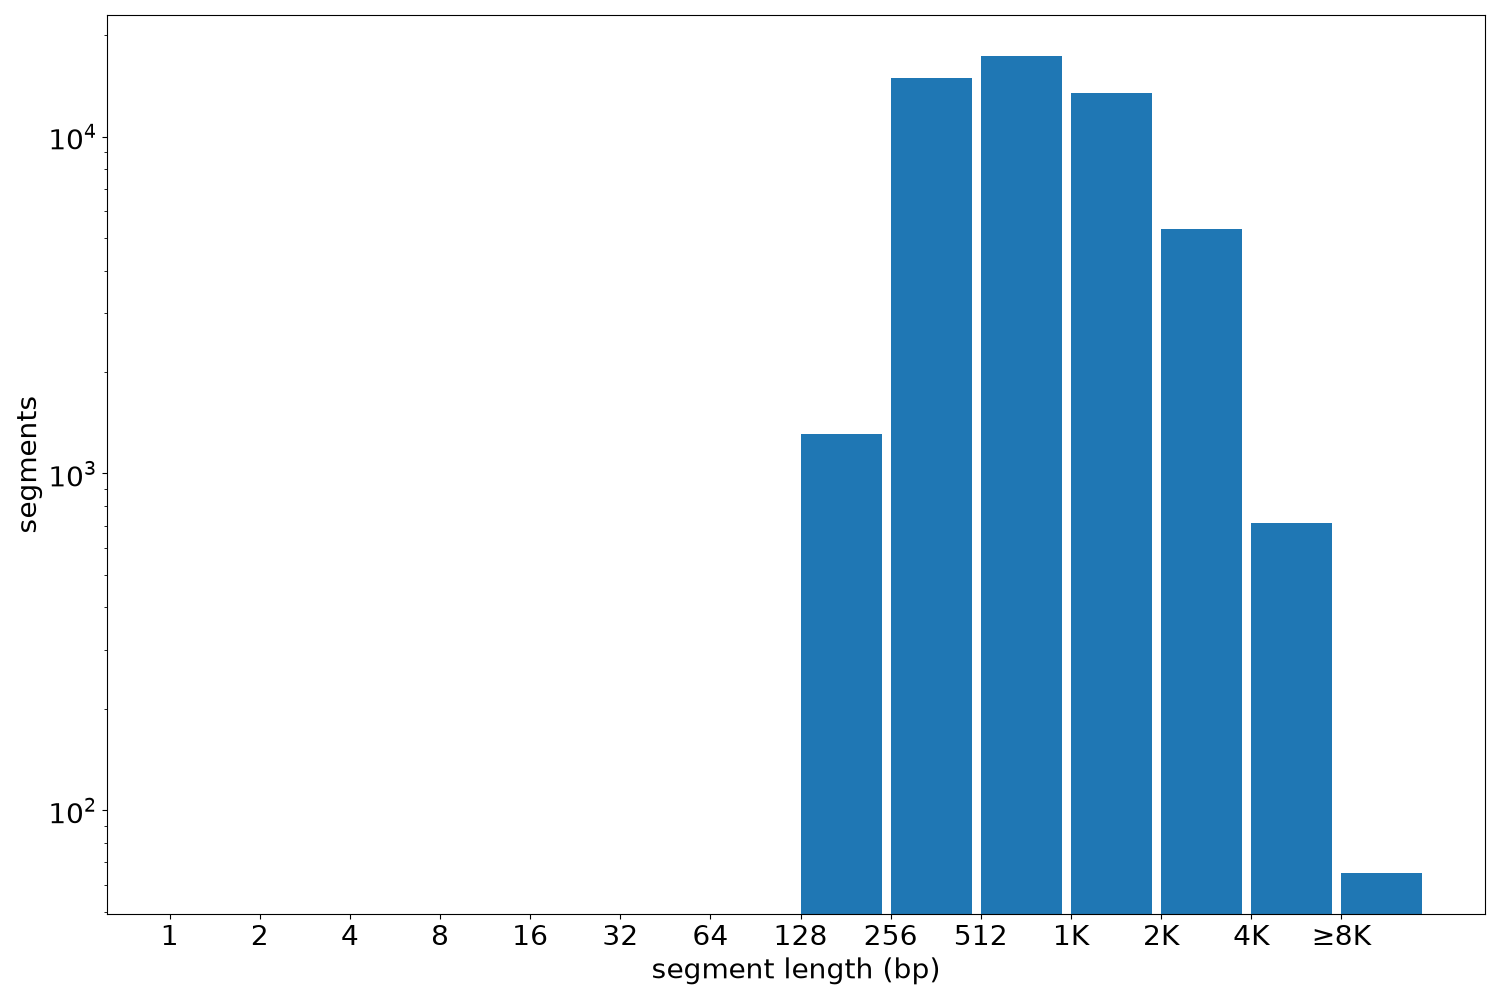
Segment lengths
| segments | min | max | mean | median | |
|---|---|---|---|---|---|
| segments | 53216 | 191 | 21306 | 1067.24 | 762 |
Files
| Filename | Size | md5 |
|---|---|---|
| ENCFF807KQU.bed.gz | 1.43 MB | ed402db262f5043389700a40ee350d1d |
| ENCFF807KQU.tabix.bed.gz | 605.88 KB | a24e2307e6dda7a00a5a4c0d22918cce |
| ENCFF807KQU.tabix.bed.gz.tbi | 207.66 KB | 3b0a81091ca56ffd5ead5cc6e6b438e5 |
| genomic_resource.yaml | 2.67 KB | 8369cb7a4f565bcf3e194fb941976584 |
| statistics/ |