Resource
| Id | Histone_ChIP-seq/ENCSR989RAL |
|---|---|
| Type | position_score |
| Version | 0 |
| Summary | Histone_ChIP-seq ENCSR989RAL [biosample_summary="Homo sapiens iPS-20b" and target="H3K4me3"] |
| Description |
status: released biological_replicates: Rep 1, Rep 2 summary: output_type: pseudoreplicated peaks audit_internal_action: Released analysis {ENCAN481QGZ|/analyses/ENCAN481QGZ/} has in progress subobject quality standard {encode4-histone-chip|/quality-standards/encode4-histone-chip/} audit_internal_action: Released analysis {ENCAN481QGZ|/analyses/ENCAN481QGZ/} has in progress subobject document {fe2deafa-9287-407d-8695-c55ab1e48246|/documents/fe2deafa-9287-407d-8695-c55ab1e48246/} audit_warning: PBC1 (PCR Bottlenecking Coefficient 1, M1/M_distinct) is the ratio of the number of genomic locations where exactly one read maps uniquely (M1) to the number of genomic locations where some reads map (M_distinct). A PBC1 value in the range 0 - 0.5 is severe bottlenecking, 0.5 - 0.8 is moderate bottlenecking, 0.8 - 0.9 is mild bottlenecking, and > 0.9 is no bottlenecking. PBC1 value > 0.9 is recommended, but > 0.8 is acceptable. ENCODE processed alignments file {ENCFF155QTK|/files/ENCFF155QTK/} processed by ChIP-seq ENCODE4 v1.5.1 GRCh38 pipeline was generated from a library with PBC1 value of 0.86. audit_warning: PBC2 (PCR Bottlenecking Coefficient 2, M1/M2) is the ratio of the number of genomic locations where exactly one read maps uniquely (M1) to the number of genomic locations where two reads map uniquely (M2). A PBC2 value in the range 0 - 1 is severe bottlenecking, 1 - 3 is moderate bottlenecking, 3 - 10 is mild bottlenecking, > 10 is no bottlenecking. PBC2 value > 10 is recommended, but > 3 is acceptable. ENCODE processed alignments file {ENCFF155QTK|/files/ENCFF155QTK/} processed by ChIP-seq ENCODE4 v1.5.1 GRCh38 pipeline was generated from a library with PBC2 value of 7.75. |
| Labels |
|
Scores (1)
| ID | Type | Default annotation | Description | Histogram | Range | Summary |
|---|---|---|---|---|---|---|
| Histone_ChIP-seq_ENCSR989RAL | float |
Histone_ChIP-seq_ENCSR989RAL |
Histone_ChIP-seq ENCSR989RAL [biosample_summary="Homo sapiens iPS-20b" and target="H3K4me3"]
|
 |
[1.64, 78.2] |
|
n counts base pairs; sd is the population standard deviation.
Coverage
| Chromosome | Covered positions | Covered % | Segments |
|---|---|---|---|
| all chromosomes | 64919896 | 2.02% | 51815 |
| chr1 | 6340974 | 2.55% | 4907 |
| chr2 | 4593322 | 1.90% | 3732 |
| chr3 | 3807183 | 1.92% | 3028 |
| chr4 | 2911977 | 1.53% | 2394 |
| chr5 | 3347940 | 1.84% | 2634 |
| chr6 | 4062138 | 2.38% | 2980 |
| chr7 | 3240486 | 2.03% | 2697 |
| chr8 | 2585417 | 1.78% | 2135 |
| chr9 | 2630580 | 1.90% | 2128 |
| chr10 | 2794261 | 2.09% | 2271 |
| chr11 | 3407994 | 2.52% | 2669 |
| chr12 | 3397396 | 2.55% | 2615 |
| chr13 | 1541060 | 1.35% | 1261 |
| chr14 | 2088863 | 1.95% | 1620 |
| chr15 | 2089776 | 2.05% | 1656 |
| chr16 | 2269998 | 2.51% | 1848 |
| chr17 | 3265196 | 3.92% | 2544 |
| chr18 | 1289362 | 1.60% | 1097 |
| chr19 | 3444575 | 5.88% | 2788 |
| chr20 | 1674915 | 2.60% | 1368 |
| chr21 | 643715 | 1.38% | 573 |
| chr22 | 1203657 | 2.37% | 1028 |
| chrX | 2192505 | 1.41% | 1756 |
| chrY | 96606 | 0.17% | 86 |
| 3342 contigs with no values (129077085 bp) | 0 | 0.00% | 0 |
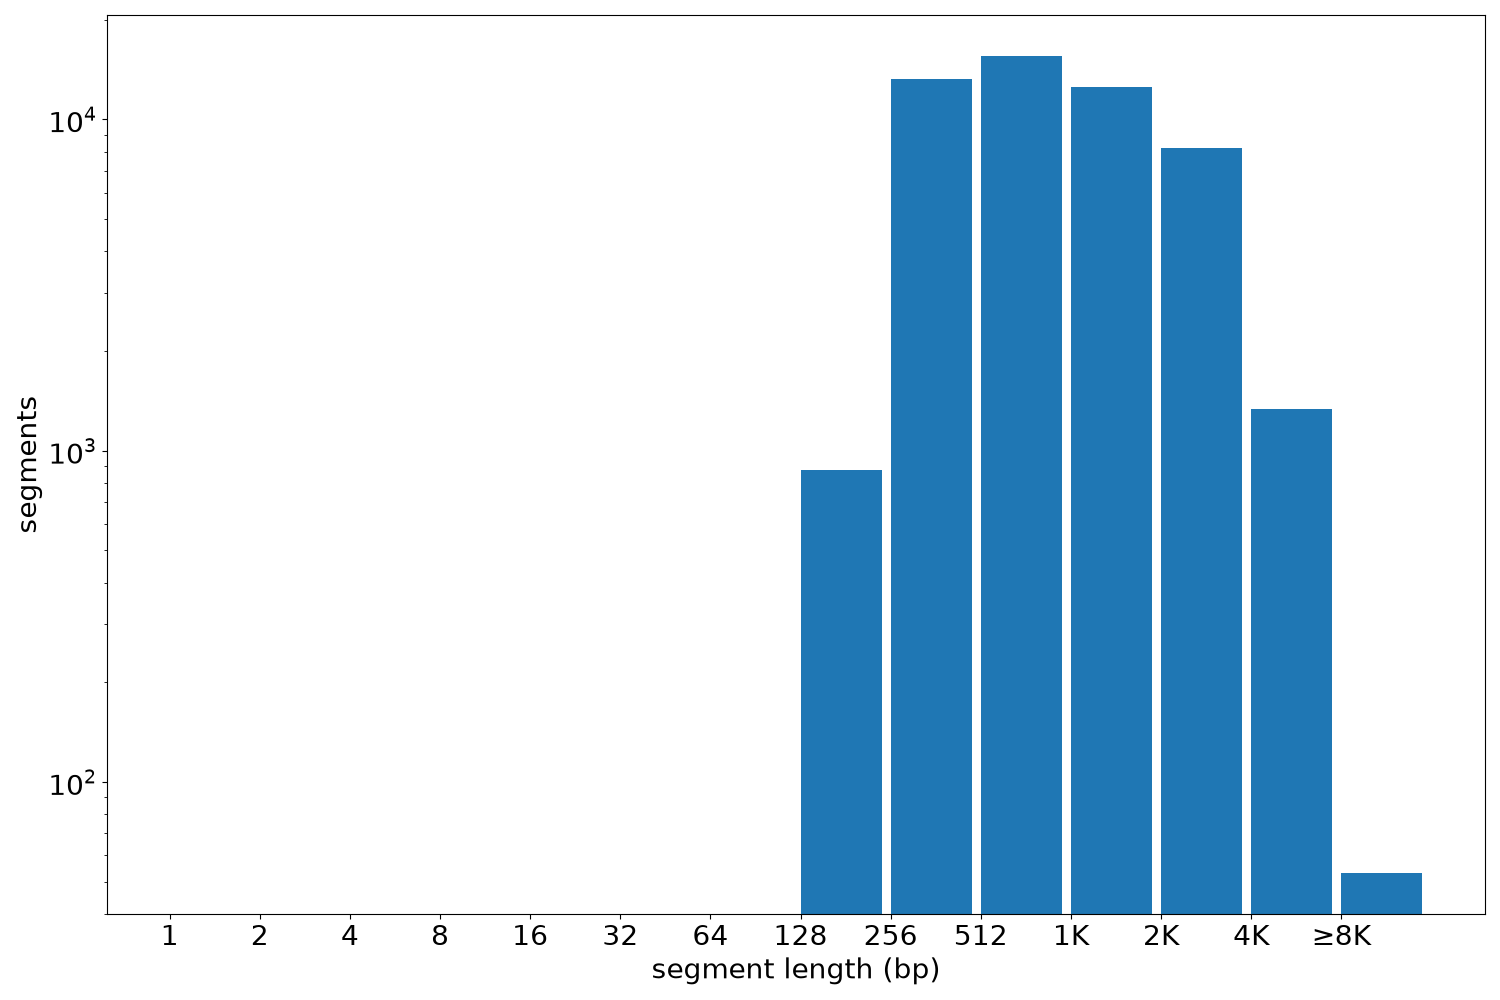
Segment lengths
| segments | min | max | mean | median | |
|---|---|---|---|---|---|
| segments | 51815 | 195 | 16200 | 1252.92 | 853 |
Files
| Filename | Size | md5 |
|---|---|---|
| ENCFF483YLD.bed.gz | 1.35 MB | 5f2c26510708aed99906bbc1afd44926 |
| ENCFF483YLD.tabix.bed.gz | 587.19 KB | c3b365533f7873c4860d3851bfab9268 |
| ENCFF483YLD.tabix.bed.gz.tbi | 249.14 KB | 9d064c7364b29269ac533e539102b167 |
| genomic_resource.yaml | 2.91 KB | 1d50f03784445ca8483ad5bb2e957303 |
| statistics/ |