Resource
| Id | Histone_ChIP-seq/ENCSR966HBM |
|---|---|
| Type | position_score |
| Version | 0 |
| Summary | Histone_ChIP-seq ENCSR966HBM [biosample_summary="Homo sapiens DOHH2" and target="H3F3A"] |
| Description |
status: released biological_replicates: Rep 1, Rep 2 summary: output_type: replicated peaks audit_internal_action: Archived analysis {ENCAN255ICM|/analyses/ENCAN255ICM/} has in progress subobject quality standard {encode3-histone-chip|/quality-standards/encode3-histone-chip/} audit_not_compliant: Processed alignments file {ENCFF440BSH|/files/ENCFF440BSH/} processed by ChIP-seq ENCODE3 hg19 pipeline has 20293681 usable fragments. The minimum ENCODE standard for each replicate in a ChIP-seq experiment targeting H3F3A-human and investigated as a broad histone mark is 20 million usable fragments. The recommended value is > 45 million, but > 35 million is acceptable. (See {ENCODE ChIP-seq data standards|/data-standards/chip-seq/}) audit_warning: PBC1 (PCR Bottlenecking Coefficient 1, M1/M_distinct) is the ratio of the number of genomic locations where exactly one read maps uniquely (M1) to the number of genomic locations where some reads map (M_distinct). A PBC1 value in the range 0 - 0.5 is severe bottlenecking, 0.5 - 0.8 is moderate bottlenecking, 0.8 - 0.9 is mild bottlenecking, and > 0.9 is no bottlenecking. PBC1 value > 0.9 is recommended, but > 0.8 is acceptable. ENCODE processed alignments file {ENCFF191UNH|/files/ENCFF191UNH/} processed by ChIP-seq ENCODE3 hg19 pipeline was generated from a library with PBC1 value of 0.84. audit_warning: PBC2 (PCR Bottlenecking Coefficient 2, M1/M2) is the ratio of the number of genomic locations where exactly one read maps uniquely (M1) to the number of genomic locations where two reads map uniquely (M2). A PBC2 value in the range 0 - 1 is severe bottlenecking, 1 - 3 is moderate bottlenecking, 3 - 10 is mild bottlenecking, > 10 is no bottlenecking. PBC2 value > 10 is recommended, but > 3 is acceptable. ENCODE processed alignments file {ENCFF191UNH|/files/ENCFF191UNH/} processed by ChIP-seq ENCODE3 hg19 pipeline was generated from a library with PBC2 value of 6.46. audit_warning: PBC1 (PCR Bottlenecking Coefficient 1, M1/M_distinct) is the ratio of the number of genomic locations where exactly one read maps uniquely (M1) to the number of genomic locations where some reads map (M_distinct). A PBC1 value in the range 0 - 0.5 is severe bottlenecking, 0.5 - 0.8 is moderate bottlenecking, 0.8 - 0.9 is mild bottlenecking, and > 0.9 is no bottlenecking. PBC1 value > 0.9 is recommended, but > 0.8 is acceptable. ENCODE processed alignments file {ENCFF440BSH|/files/ENCFF440BSH/} processed by ChIP-seq ENCODE3 hg19 pipeline was generated from a library with PBC1 value of 0.87. audit_warning: PBC2 (PCR Bottlenecking Coefficient 2, M1/M2) is the ratio of the number of genomic locations where exactly one read maps uniquely (M1) to the number of genomic locations where two reads map uniquely (M2). A PBC2 value in the range 0 - 1 is severe bottlenecking, 1 - 3 is moderate bottlenecking, 3 - 10 is mild bottlenecking, > 10 is no bottlenecking. PBC2 value > 10 is recommended, but > 3 is acceptable. ENCODE processed alignments file {ENCFF440BSH|/files/ENCFF440BSH/} processed by ChIP-seq ENCODE3 hg19 pipeline was generated from a library with PBC2 value of 7.44. |
| Labels |
|
Scores (1)
| ID | Type | Default annotation | Description | Histogram | Range | Summary |
|---|---|---|---|---|---|---|
| Histone_ChIP-seq_ENCSR966HBM | float |
Histone_ChIP-seq_ENCSR966HBM |
Histone_ChIP-seq ENCSR966HBM [biosample_summary="Homo sapiens DOHH2" and target="H3F3A"]
|
 |
[1.53, 14.1] |
|
n counts base pairs; sd is the population standard deviation.
Coverage
| Chromosome | Covered positions | Covered % | Segments |
|---|---|---|---|
| all chromosomes | 37858048 | 1.18% | 70854 |
| chr1 | 3534446 | 1.42% | 6689 |
| chr2 | 2892381 | 1.19% | 5417 |
| chr3 | 2386254 | 1.20% | 4363 |
| chr4 | 1697874 | 0.89% | 3088 |
| chr5 | 1671805 | 0.92% | 3185 |
| chr6 | 2386626 | 1.40% | 4266 |
| chr7 | 2391960 | 1.50% | 4356 |
| chr8 | 1569982 | 1.08% | 2861 |
| chr9 | 1421146 | 1.03% | 2630 |
| chr10 | 1812690 | 1.35% | 3319 |
| chr11 | 1812581 | 1.34% | 3291 |
| chr12 | 2251900 | 1.69% | 4184 |
| chr13 | 900153 | 0.79% | 1639 |
| chr14 | 1351711 | 1.26% | 2598 |
| chr15 | 1265672 | 1.24% | 2459 |
| chr16 | 1326710 | 1.47% | 2567 |
| chr17 | 2106282 | 2.53% | 4112 |
| chr18 | 544157 | 0.68% | 1098 |
| chr19 | 1525873 | 2.60% | 3102 |
| chr20 | 1150786 | 1.79% | 2103 |
| chr21 | 411277 | 0.88% | 743 |
| chr22 | 943623 | 1.86% | 1802 |
| chrX | 475150 | 0.30% | 938 |
| chrY | 27009 | 0.05% | 44 |
| 3342 contigs with no values (129077085 bp) | 0 | 0.00% | 0 |
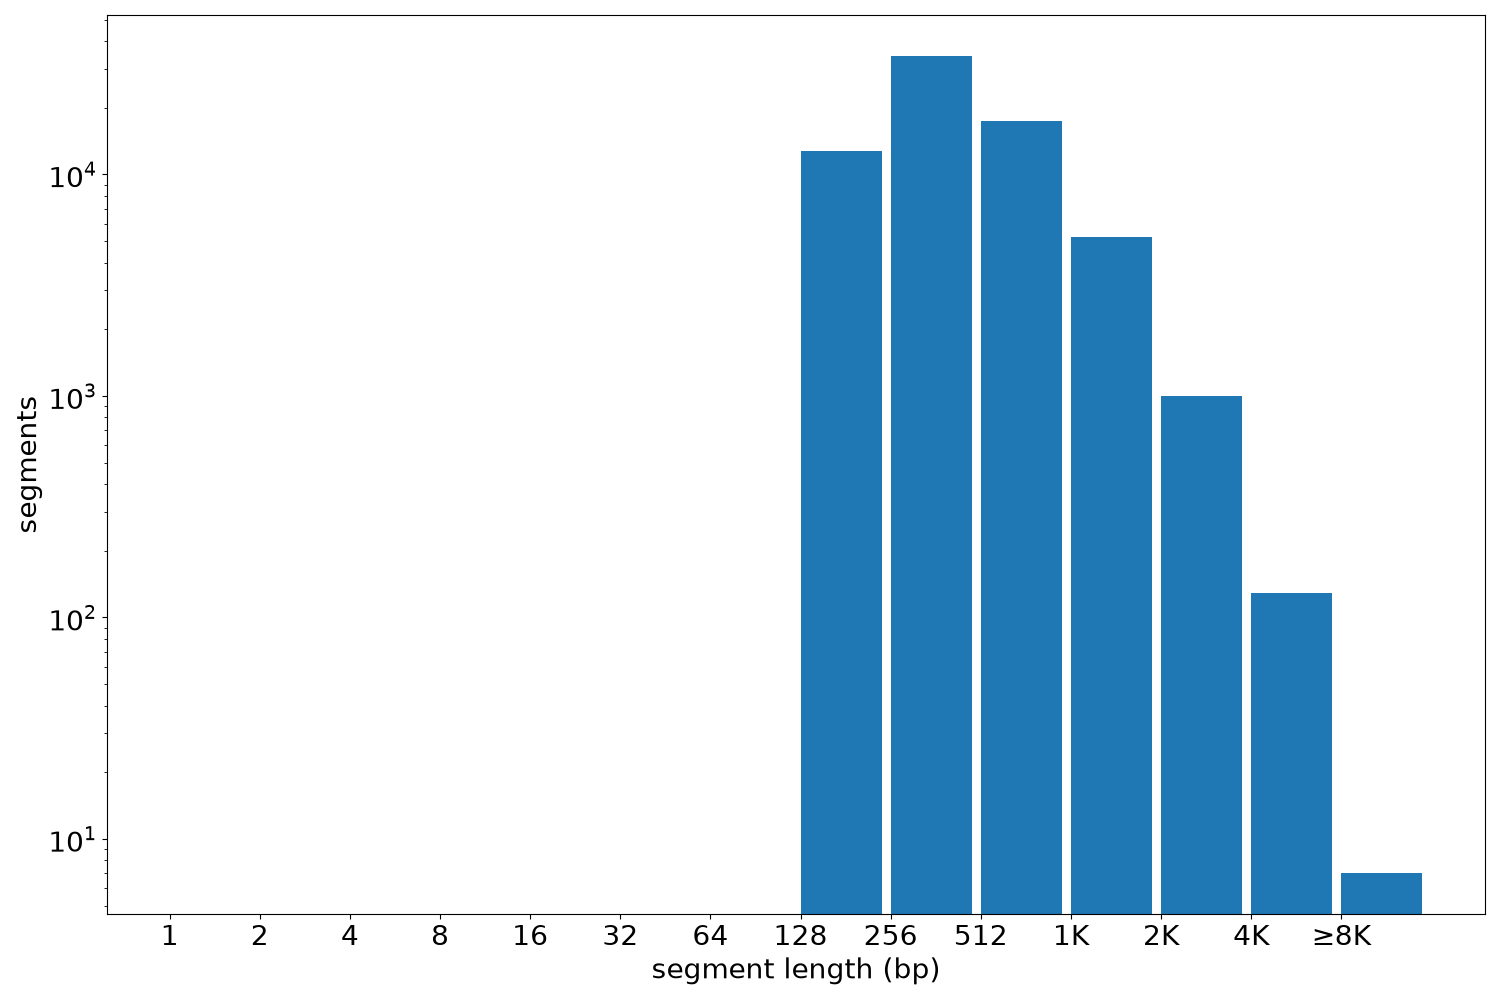
Segment lengths
| segments | min | max | mean | median | |
|---|---|---|---|---|---|
| segments | 70854 | 180 | 12532 | 534.31 | 394 |
Files
| Filename | Size | md5 |
|---|---|---|
| ENCFF626RMN.bed.gz | 1.53 MB | d4ac01f0648718a221ee72cf8aa0ac7a |
| ENCFF626RMN.tabix.bed.gz | 732.01 KB | 7a8b3d579dda920468915544d8b2d8a8 |
| ENCFF626RMN.tabix.bed.gz.tbi | 186.68 KB | 4d9767d7f0ff77bb7176e56b55b341e0 |
| genomic_resource.yaml | 4.64 KB | 8726f16f80b0c5a07ed8d52eea49fa2f |
| statistics/ |