Resource
| Id | Histone_ChIP-seq/ENCSR965CIV |
|---|---|
| Type | position_score |
| Version | 0 |
| Summary | Histone_ChIP-seq ENCSR965CIV [biosample_summary="Homo sapiens dorsolateral prefrontal cortex tissue male adult (86 years)" and target="H3K4me3"] |
| Description |
status: released biological_replicates: Rep 1 summary: male adult (86 years) output_type: pseudoreplicated peaks audit_internal_action: Released analysis {ENCAN861CFU|/analyses/ENCAN861CFU/} has in progress subobject quality standard {encode4-histone-chip|/quality-standards/encode4-histone-chip/} audit_warning: PBC1 (PCR Bottlenecking Coefficient 1, M1/M_distinct) is the ratio of the number of genomic locations where exactly one read maps uniquely (M1) to the number of genomic locations where some reads map (M_distinct). A PBC1 value in the range 0 - 0.5 is severe bottlenecking, 0.5 - 0.8 is moderate bottlenecking, 0.8 - 0.9 is mild bottlenecking, and > 0.9 is no bottlenecking. PBC1 value > 0.9 is recommended, but > 0.8 is acceptable. ENCODE processed alignments file {ENCFF910MRN|/files/ENCFF910MRN/} processed by ChIP-seq ENCODE4 v1.8.0 GRCh38 pipeline was generated from a library with PBC1 value of 0.87. audit_warning: PBC2 (PCR Bottlenecking Coefficient 2, M1/M2) is the ratio of the number of genomic locations where exactly one read maps uniquely (M1) to the number of genomic locations where two reads map uniquely (M2). A PBC2 value in the range 0 - 1 is severe bottlenecking, 1 - 3 is moderate bottlenecking, 3 - 10 is mild bottlenecking, > 10 is no bottlenecking. PBC2 value > 10 is recommended, but > 3 is acceptable. ENCODE processed alignments file {ENCFF910MRN|/files/ENCFF910MRN/} processed by ChIP-seq ENCODE4 v1.8.0 GRCh38 pipeline was generated from a library with PBC2 value of 8.57. |
| Labels |
|
Scores (1)
| ID | Type | Default annotation | Description | Histogram | Range | Summary |
|---|---|---|---|---|---|---|
| Histone_ChIP-seq_ENCSR965CIV | float |
Histone_ChIP-seq_ENCSR965CIV |
Histone_ChIP-seq ENCSR965CIV [biosample_summary="Homo sapiens dorsolateral prefrontal cortex tissue male adult (86 years)" and target="H3K4me3"]
|
 |
[1.79, 80.6] |
|
n counts base pairs; sd is the population standard deviation.
Coverage
| Chromosome | Covered positions | Covered % | Segments |
|---|---|---|---|
| all chromosomes | 69785686 | 2.17% | 37754 |
| chr1 | 6753766 | 2.71% | 3588 |
| chr2 | 4963724 | 2.05% | 2761 |
| chr3 | 4164186 | 2.10% | 2204 |
| chr4 | 2943189 | 1.55% | 1622 |
| chr5 | 3624543 | 2.00% | 1986 |
| chr6 | 4147014 | 2.43% | 2274 |
| chr7 | 3413203 | 2.14% | 1973 |
| chr8 | 2795776 | 1.93% | 1562 |
| chr9 | 2884539 | 2.08% | 1605 |
| chr10 | 3063002 | 2.29% | 1690 |
| chr11 | 3695532 | 2.74% | 1912 |
| chr12 | 3661698 | 2.75% | 1868 |
| chr13 | 1696113 | 1.48% | 989 |
| chr14 | 2230072 | 2.08% | 1193 |
| chr15 | 2190795 | 2.15% | 1217 |
| chr16 | 2623018 | 2.90% | 1442 |
| chr17 | 3717670 | 4.47% | 1933 |
| chr18 | 1361921 | 1.69% | 772 |
| chr19 | 3957893 | 6.75% | 2042 |
| chr20 | 1764624 | 2.74% | 953 |
| chr21 | 705789 | 1.51% | 407 |
| chr22 | 1483895 | 2.92% | 767 |
| chrX | 1882042 | 1.21% | 964 |
| chrY | 61682 | 0.11% | 30 |
| 3342 contigs with no values (129077085 bp) | 0 | 0.00% | 0 |
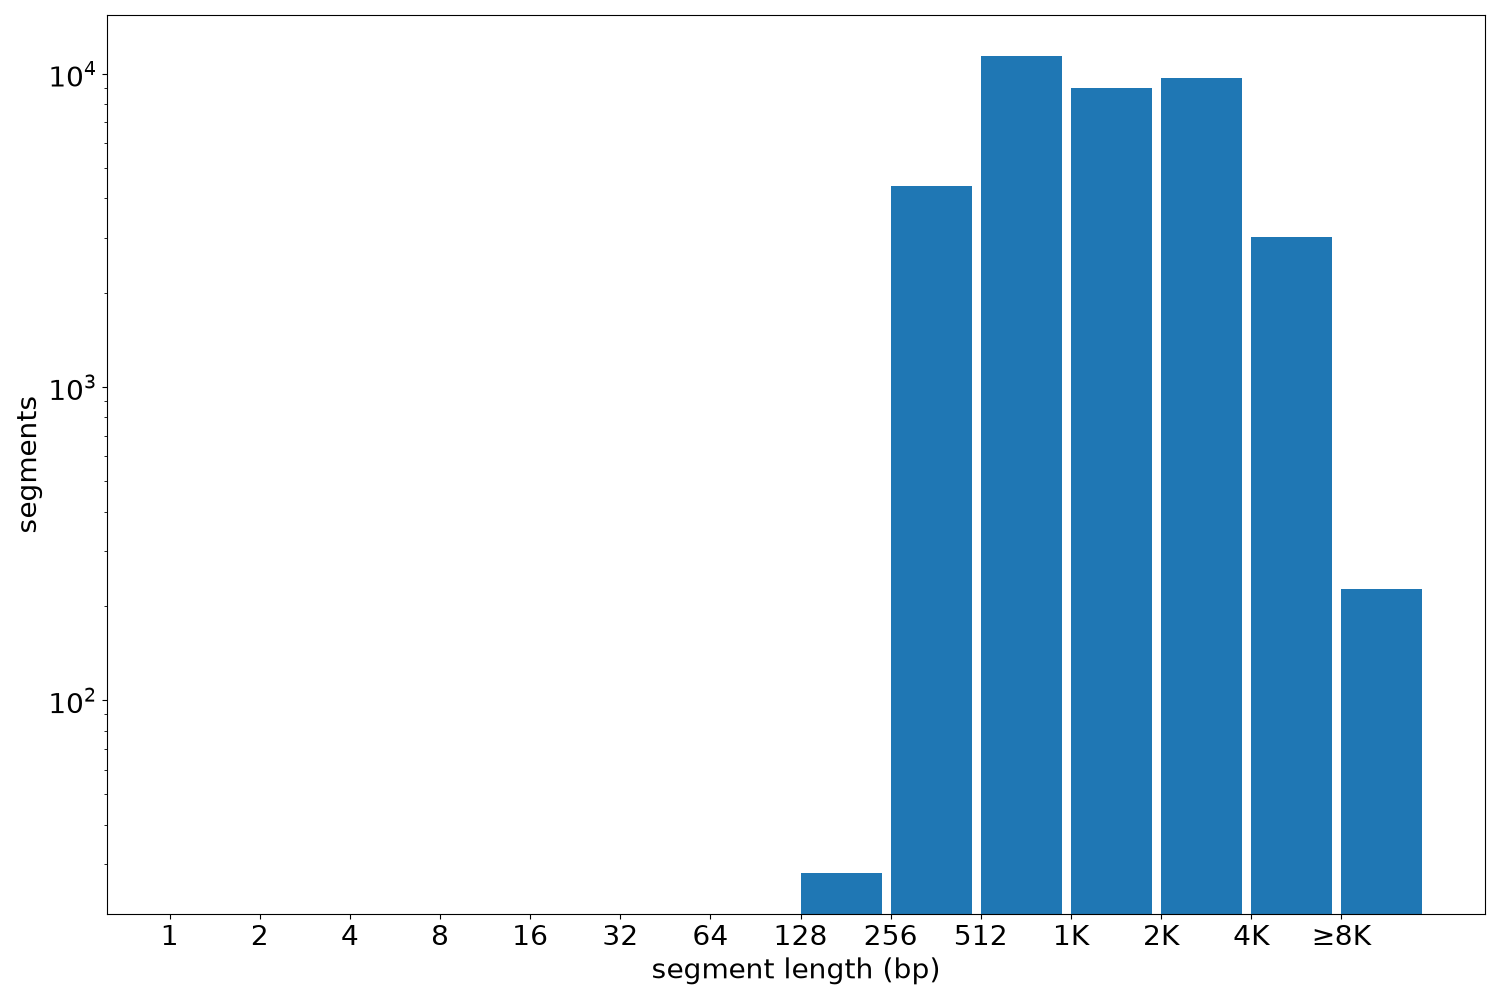
Segment lengths
| segments | min | max | mean | median | |
|---|---|---|---|---|---|
| segments | 37754 | 230 | 35871 | 1848.43 | 1259.5 |
Files
| Filename | Size | md5 |
|---|---|---|
| ENCFF014FUG.bed.gz | 961.86 KB | fffed0c8c4e354d4af191582a5874beb |
| ENCFF014FUG.tabix.bed.gz | 424.68 KB | 112fb4cc582b42dc86b3971085fb0ef7 |
| ENCFF014FUG.tabix.bed.gz.tbi | 216.25 KB | 00483485cad5892991976798e8d3afaa |
| genomic_resource.yaml | 2.83 KB | 905e43a4096dc07b86196f0a88f29704 |
| statistics/ |