Resource
| Id | Histone_ChIP-seq/ENCSR957GYL |
|---|---|
| Type | position_score |
| Version | 0 |
| Summary | Histone_ChIP-seq ENCSR957GYL [biosample_summary="Homo sapiens H9" and target="H3T11ph"] |
| Description |
status: released biological_replicates: Rep 1 summary: output_type: pseudoreplicated peaks audit_internal_action: Released analysis {ENCAN385TKE|/analyses/ENCAN385TKE/} has in progress subobject quality standard {encode4-histone-chip|/quality-standards/encode4-histone-chip/} audit_internal_action: Released analysis {ENCAN385TKE|/analyses/ENCAN385TKE/} has in progress subobject document {43a5b597-d4b0-4ea8-9cc1-7c40a68dece8|/documents/43a5b597-d4b0-4ea8-9cc1-7c40a68dece8/} audit_warning: PBC1 (PCR Bottlenecking Coefficient 1, M1/M_distinct) is the ratio of the number of genomic locations where exactly one read maps uniquely (M1) to the number of genomic locations where some reads map (M_distinct). A PBC1 value in the range 0 - 0.5 is severe bottlenecking, 0.5 - 0.8 is moderate bottlenecking, 0.8 - 0.9 is mild bottlenecking, and > 0.9 is no bottlenecking. PBC1 value > 0.9 is recommended, but > 0.8 is acceptable. ENCODE processed alignments file {ENCFF076YTT|/files/ENCFF076YTT/} processed by ChIP-seq ENCODE4 v1.6.1 GRCh38 pipeline was generated from a library with PBC1 value of 0.79. audit_warning: PBC2 (PCR Bottlenecking Coefficient 2, M1/M2) is the ratio of the number of genomic locations where exactly one read maps uniquely (M1) to the number of genomic locations where two reads map uniquely (M2). A PBC2 value in the range 0 - 1 is severe bottlenecking, 1 - 3 is moderate bottlenecking, 3 - 10 is mild bottlenecking, > 10 is no bottlenecking. PBC2 value > 10 is recommended, but > 3 is acceptable. ENCODE processed alignments file {ENCFF076YTT|/files/ENCFF076YTT/} processed by ChIP-seq ENCODE4 v1.6.1 GRCh38 pipeline was generated from a library with PBC2 value of 4.67. |
| Labels |
|
Scores (1)
| ID | Type | Default annotation | Description | Histogram | Range | Summary |
|---|---|---|---|---|---|---|
| Histone_ChIP-seq_ENCSR957GYL | float |
Histone_ChIP-seq_ENCSR957GYL |
Histone_ChIP-seq ENCSR957GYL [biosample_summary="Homo sapiens H9" and target="H3T11ph"]
|
 |
[1.89, 13.3] |
|
n counts base pairs; sd is the population standard deviation.
Coverage
| Chromosome | Covered positions | Covered % | Segments |
|---|---|---|---|
| all chromosomes | 1285857 | 0.04% | 6699 |
| chr1 | 119219 | 0.05% | 599 |
| chr2 | 88518 | 0.04% | 487 |
| chr3 | 90025 | 0.05% | 483 |
| chr4 | 66342 | 0.03% | 364 |
| chr5 | 82882 | 0.05% | 437 |
| chr6 | 104873 | 0.06% | 527 |
| chr7 | 76004 | 0.05% | 397 |
| chr8 | 58918 | 0.04% | 317 |
| chr9 | 45427 | 0.03% | 257 |
| chr10 | 62639 | 0.05% | 314 |
| chr11 | 57843 | 0.04% | 294 |
| chr12 | 69166 | 0.05% | 361 |
| chr13 | 28853 | 0.03% | 169 |
| chr14 | 45119 | 0.04% | 230 |
| chr15 | 36050 | 0.04% | 177 |
| chr16 | 31826 | 0.04% | 161 |
| chr17 | 41163 | 0.05% | 211 |
| chr18 | 36942 | 0.05% | 186 |
| chr19 | 41927 | 0.07% | 192 |
| chr20 | 28441 | 0.04% | 152 |
| chr21 | 11399 | 0.02% | 63 |
| chr22 | 15359 | 0.03% | 77 |
| chrX | 46922 | 0.03% | 244 |
| 3343 contigs with no values (186304500 bp) | 0 | 0.00% | 0 |
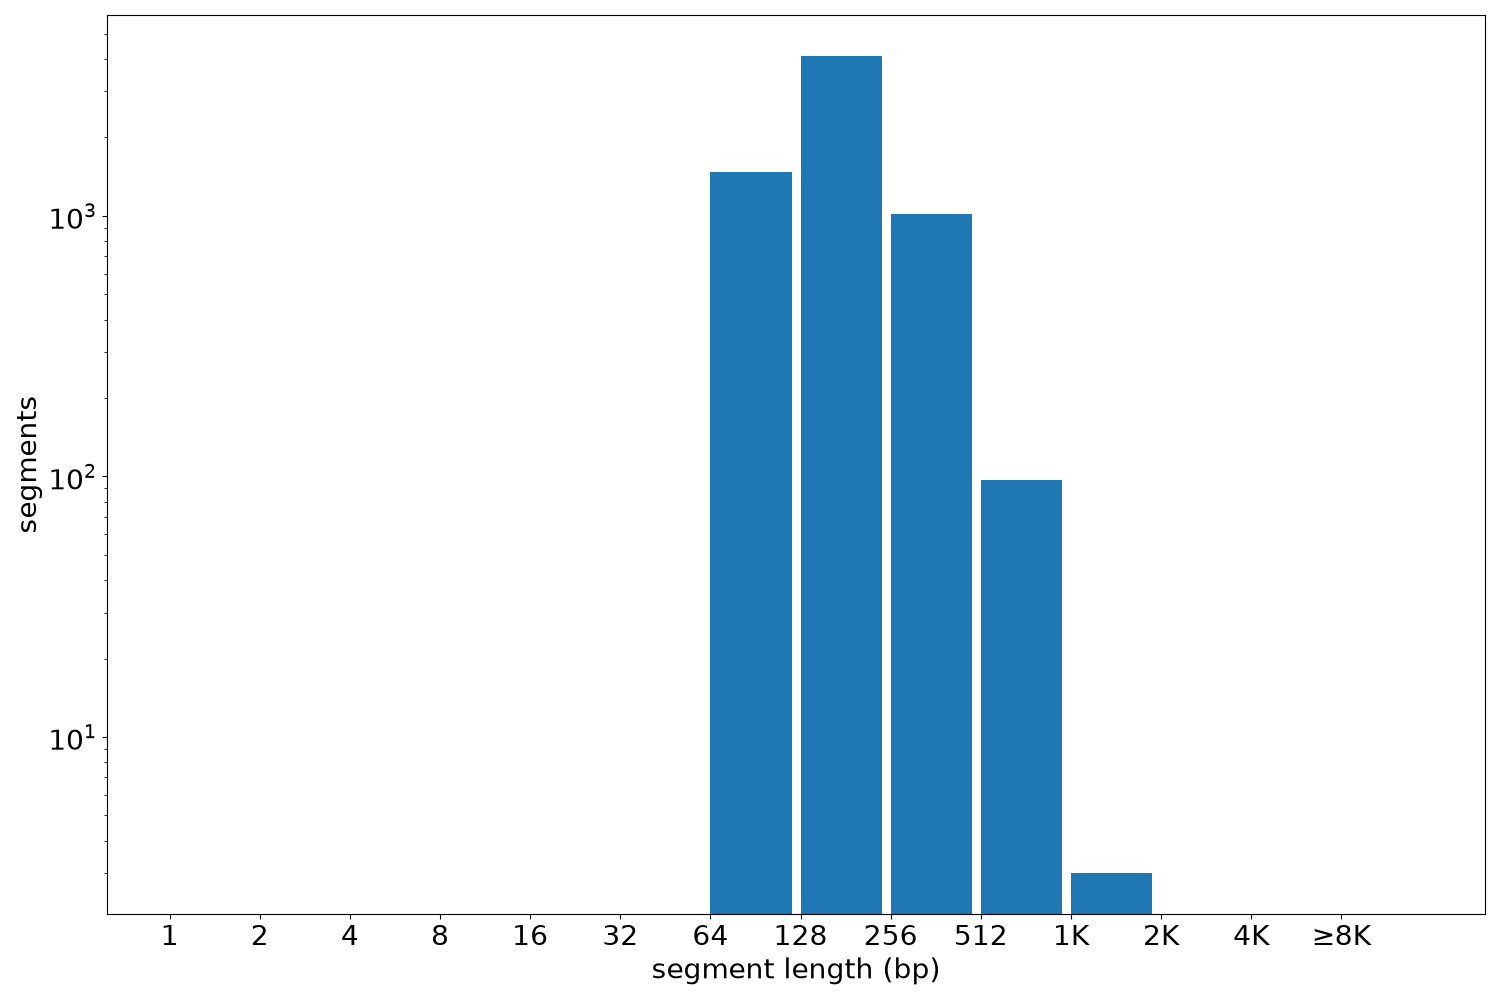
Segment lengths
| segments | min | max | mean | median | |
|---|---|---|---|---|---|
| segments | 6699 | 120 | 1280 | 191.95 | 158 |
Files
| Filename | Size | md5 |
|---|---|---|
| ENCFF220DPH.bed.gz | 126.39 KB | e786b14ab1d2ecdfb33a9100199ea4fb |
| ENCFF220DPH.tabix.bed.gz | 67.42 KB | 8037e0519e30d76dfb08f822249dd140 |
| ENCFF220DPH.tabix.bed.gz.tbi | 55.07 KB | 91a35a2307c15b37f530591edc11e205 |
| genomic_resource.yaml | 2.89 KB | d71586cdd2e08f2beab1bfa882ca7166 |
| statistics/ |