Resource
| Id | Histone_ChIP-seq/ENCSR957CQH |
|---|---|
| Type | position_score |
| Version | 0 |
| Summary | Histone_ChIP-seq ENCSR957CQH [biosample_summary="Homo sapiens OCI-LY3" and target="H3K79me2"] |
| Description |
status: released biological_replicates: Rep 1, Rep 2 summary: output_type: pseudoreplicated peaks audit_internal_action: Released analysis {ENCAN473GOW|/analyses/ENCAN473GOW/} has in progress subobject document {2fef132e-d9b2-4a3e-b7ff-c53f5596dae7|/documents/2fef132e-d9b2-4a3e-b7ff-c53f5596dae7/} audit_internal_action: Released analysis {ENCAN473GOW|/analyses/ENCAN473GOW/} has in progress subobject quality standard {encode4-histone-chip|/quality-standards/encode4-histone-chip/} audit_warning: PBC1 (PCR Bottlenecking Coefficient 1, M1/M_distinct) is the ratio of the number of genomic locations where exactly one read maps uniquely (M1) to the number of genomic locations where some reads map (M_distinct). A PBC1 value in the range 0 - 0.5 is severe bottlenecking, 0.5 - 0.8 is moderate bottlenecking, 0.8 - 0.9 is mild bottlenecking, and > 0.9 is no bottlenecking. PBC1 value > 0.9 is recommended, but > 0.8 is acceptable. ENCODE processed alignments file {ENCFF726IMU|/files/ENCFF726IMU/} processed by ChIP-seq ENCODE4 v1.6.1 GRCh38 pipeline was generated from a library with PBC1 value of 0.88. audit_warning: PBC2 (PCR Bottlenecking Coefficient 2, M1/M2) is the ratio of the number of genomic locations where exactly one read maps uniquely (M1) to the number of genomic locations where two reads map uniquely (M2). A PBC2 value in the range 0 - 1 is severe bottlenecking, 1 - 3 is moderate bottlenecking, 3 - 10 is mild bottlenecking, > 10 is no bottlenecking. PBC2 value > 10 is recommended, but > 3 is acceptable. ENCODE processed alignments file {ENCFF726IMU|/files/ENCFF726IMU/} processed by ChIP-seq ENCODE4 v1.6.1 GRCh38 pipeline was generated from a library with PBC2 value of 9.15. |
| Labels |
|
Scores (1)
| ID | Type | Default annotation | Description | Histogram | Range | Summary |
|---|---|---|---|---|---|---|
| Histone_ChIP-seq_ENCSR957CQH | float |
Histone_ChIP-seq_ENCSR957CQH |
Histone_ChIP-seq ENCSR957CQH [biosample_summary="Homo sapiens OCI-LY3" and target="H3K79me2"]
|
 |
[1.5, 46.5] |
|
n counts base pairs; sd is the population standard deviation.
Coverage
| Chromosome | Covered positions | Covered % | Segments |
|---|---|---|---|
| all chromosomes | 107365671 | 3.34% | 70604 |
| chr1 | 9667222 | 3.88% | 6489 |
| chr2 | 7999150 | 3.30% | 5297 |
| chr3 | 7928454 | 4.00% | 5012 |
| chr4 | 4706282 | 2.47% | 3253 |
| chr5 | 4703795 | 2.59% | 2991 |
| chr6 | 5508964 | 3.23% | 3705 |
| chr7 | 6150733 | 3.86% | 4129 |
| chr8 | 4090596 | 2.82% | 2814 |
| chr9 | 4393907 | 3.17% | 2932 |
| chr10 | 3808966 | 2.85% | 2780 |
| chr11 | 5397784 | 4.00% | 3480 |
| chr12 | 5899926 | 4.43% | 3871 |
| chr13 | 2653160 | 2.32% | 1584 |
| chr14 | 3367756 | 3.15% | 2332 |
| chr15 | 3742834 | 3.67% | 2661 |
| chr16 | 4248824 | 4.70% | 2768 |
| chr17 | 4737783 | 5.69% | 3280 |
| chr18 | 2871118 | 3.57% | 1563 |
| chr19 | 5040147 | 8.60% | 3219 |
| chr20 | 3454747 | 5.36% | 1848 |
| chr21 | 951937 | 2.04% | 616 |
| chr22 | 3116676 | 6.13% | 1858 |
| chrX | 2664090 | 1.71% | 1943 |
| chrY | 260820 | 0.46% | 179 |
| 3342 contigs with no values (129077085 bp) | 0 | 0.00% | 0 |
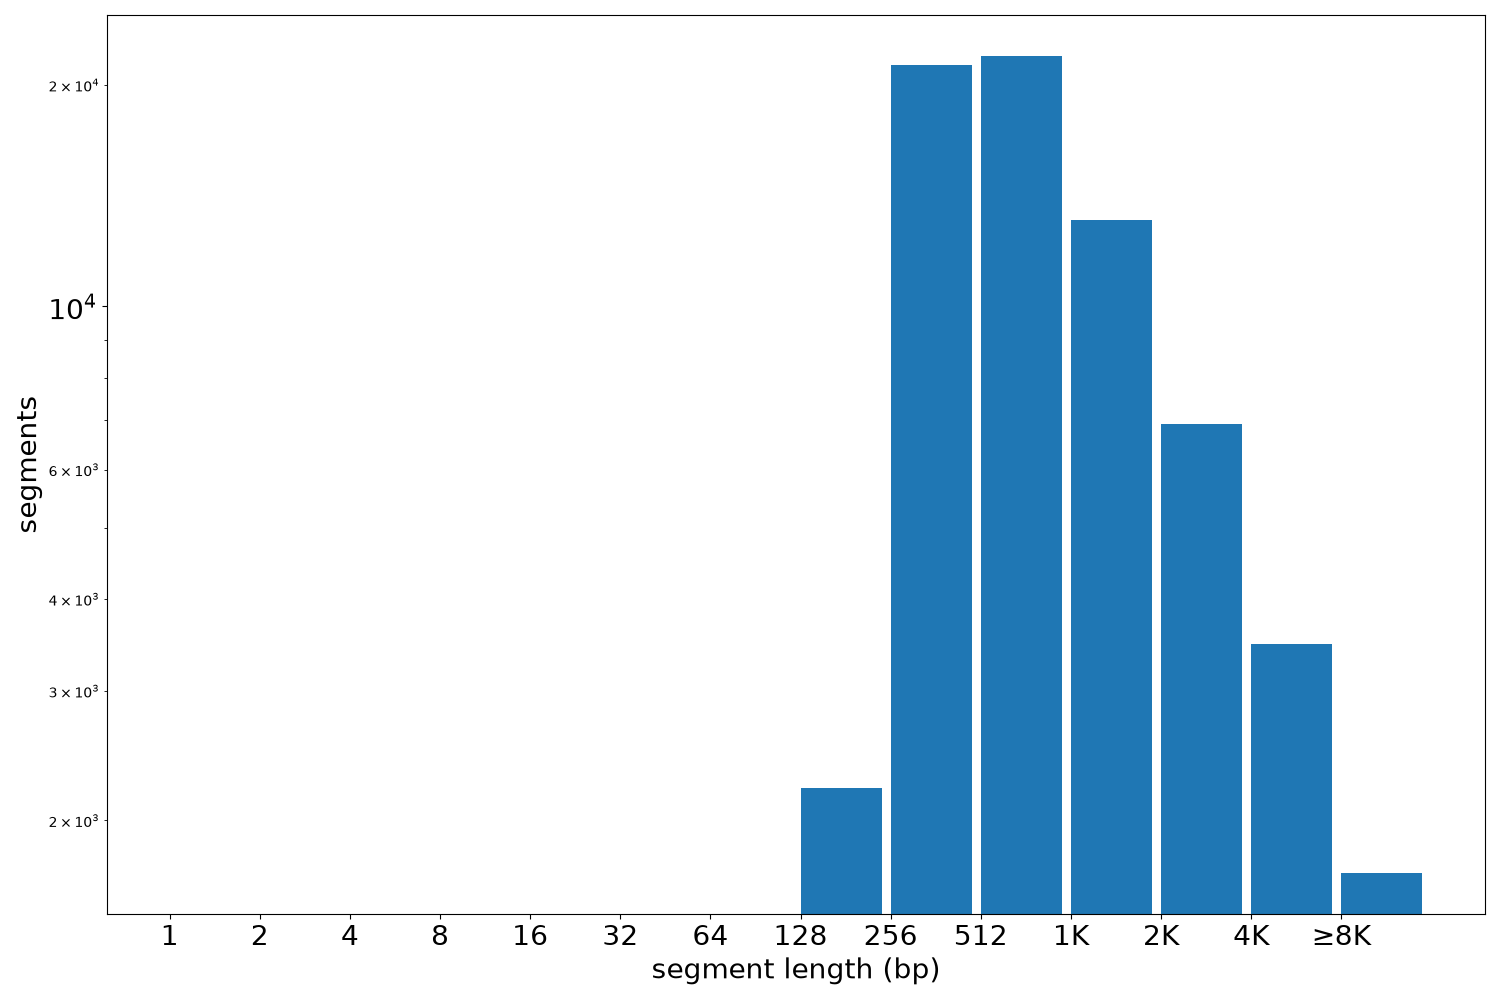
Segment lengths
| segments | min | max | mean | median | |
|---|---|---|---|---|---|
| segments | 70604 | 193 | 200459 | 1520.67 | 716 |
Files
| Filename | Size | md5 |
|---|---|---|
| ENCFF638SRX.bed.gz | 1.72 MB | 1fd006c176542b49cbfc5699f9b12df6 |
| ENCFF638SRX.tabix.bed.gz | 759.35 KB | 4deab2125bc8c38549eb0cdfdcf9d76c |
| ENCFF638SRX.tabix.bed.gz.tbi | 113.08 KB | 3149fa0ae5cd929b96e6ffe306a17ae7 |
| genomic_resource.yaml | 2.91 KB | d8ee03b0bb00d966f5326e357f11a473 |
| statistics/ |