Resource
| Id | Histone_ChIP-seq/ENCSR922JMI |
|---|---|
| Type | position_score |
| Version | 0 |
| Summary | Histone_ChIP-seq ENCSR922JMI [biosample_summary="Homo sapiens subcutaneous abdominal adipose tissue tissue nuclear fraction female adult (25 years)" and target="H3K9ac"] |
| Description |
status: released biological_replicates: Rep 1 summary: female adult (25 years) nuclear fraction output_type: pseudoreplicated peaks audit_internal_action: Archived analysis {ENCAN649QGM|/analyses/ENCAN649QGM/} has in progress subobject quality standard {encode3-histone-chip|/quality-standards/encode3-histone-chip/} audit_warning: PBC1 (PCR Bottlenecking Coefficient 1, M1/M_distinct) is the ratio of the number of genomic locations where exactly one read maps uniquely (M1) to the number of genomic locations where some reads map (M_distinct). A PBC1 value in the range 0 - 0.5 is severe bottlenecking, 0.5 - 0.8 is moderate bottlenecking, 0.8 - 0.9 is mild bottlenecking, and > 0.9 is no bottlenecking. PBC1 value > 0.9 is recommended, but > 0.8 is acceptable. ENCODE processed redacted alignments file {ENCFF934ZJQ|/files/ENCFF934ZJQ/} processed by ChIP-seq ENCODE3 hg19 pipeline was generated from a library with PBC1 value of 0.81. audit_warning: PBC2 (PCR Bottlenecking Coefficient 2, M1/M2) is the ratio of the number of genomic locations where exactly one read maps uniquely (M1) to the number of genomic locations where two reads map uniquely (M2). A PBC2 value in the range 0 - 1 is severe bottlenecking, 1 - 3 is moderate bottlenecking, 3 - 10 is mild bottlenecking, > 10 is no bottlenecking. PBC2 value > 10 is recommended, but > 3 is acceptable. ENCODE processed redacted alignments file {ENCFF934ZJQ|/files/ENCFF934ZJQ/} processed by ChIP-seq ENCODE3 hg19 pipeline was generated from a library with PBC2 value of 5.26. |
| Labels |
|
Scores (1)
| ID | Type | Default annotation | Description | Histogram | Range | Summary |
|---|---|---|---|---|---|---|
| Histone_ChIP-seq_ENCSR922JMI | float |
Histone_ChIP-seq_ENCSR922JMI |
Histone_ChIP-seq ENCSR922JMI [biosample_summary="Homo sapiens subcutaneous abdominal adipose tissue tissue nuclear fraction female adult (25 years)" and target="H3K9ac"]
|
 |
[1.86, 62.1] |
|
n counts base pairs; sd is the population standard deviation.
Coverage
| Chromosome | Covered positions | Covered % | Segments |
|---|---|---|---|
| all chromosomes | 44079415 | 1.37% | 51227 |
| chr1 | 4471687 | 1.80% | 5095 |
| chr2 | 3091766 | 1.28% | 3605 |
| chr3 | 2656978 | 1.34% | 3026 |
| chr4 | 1543859 | 0.81% | 1753 |
| chr5 | 2145339 | 1.18% | 2414 |
| chr6 | 2335393 | 1.37% | 2629 |
| chr7 | 2016432 | 1.27% | 2403 |
| chr8 | 1650896 | 1.14% | 1959 |
| chr9 | 1989510 | 1.44% | 2370 |
| chr10 | 2064277 | 1.54% | 2480 |
| chr11 | 2643633 | 1.96% | 2932 |
| chr12 | 2380873 | 1.79% | 2662 |
| chr13 | 845310 | 0.74% | 988 |
| chr14 | 1507423 | 1.41% | 1771 |
| chr15 | 1482903 | 1.45% | 1775 |
| chr16 | 1697254 | 1.88% | 2068 |
| chr17 | 2650980 | 3.18% | 3111 |
| chr18 | 725872 | 0.90% | 933 |
| chr19 | 2525423 | 4.31% | 2837 |
| chr20 | 1211728 | 1.88% | 1461 |
| chr21 | 474943 | 1.02% | 566 |
| chr22 | 1129992 | 2.22% | 1375 |
| chrX | 836944 | 0.54% | 1014 |
| 3343 contigs with no values (186304500 bp) | 0 | 0.00% | 0 |
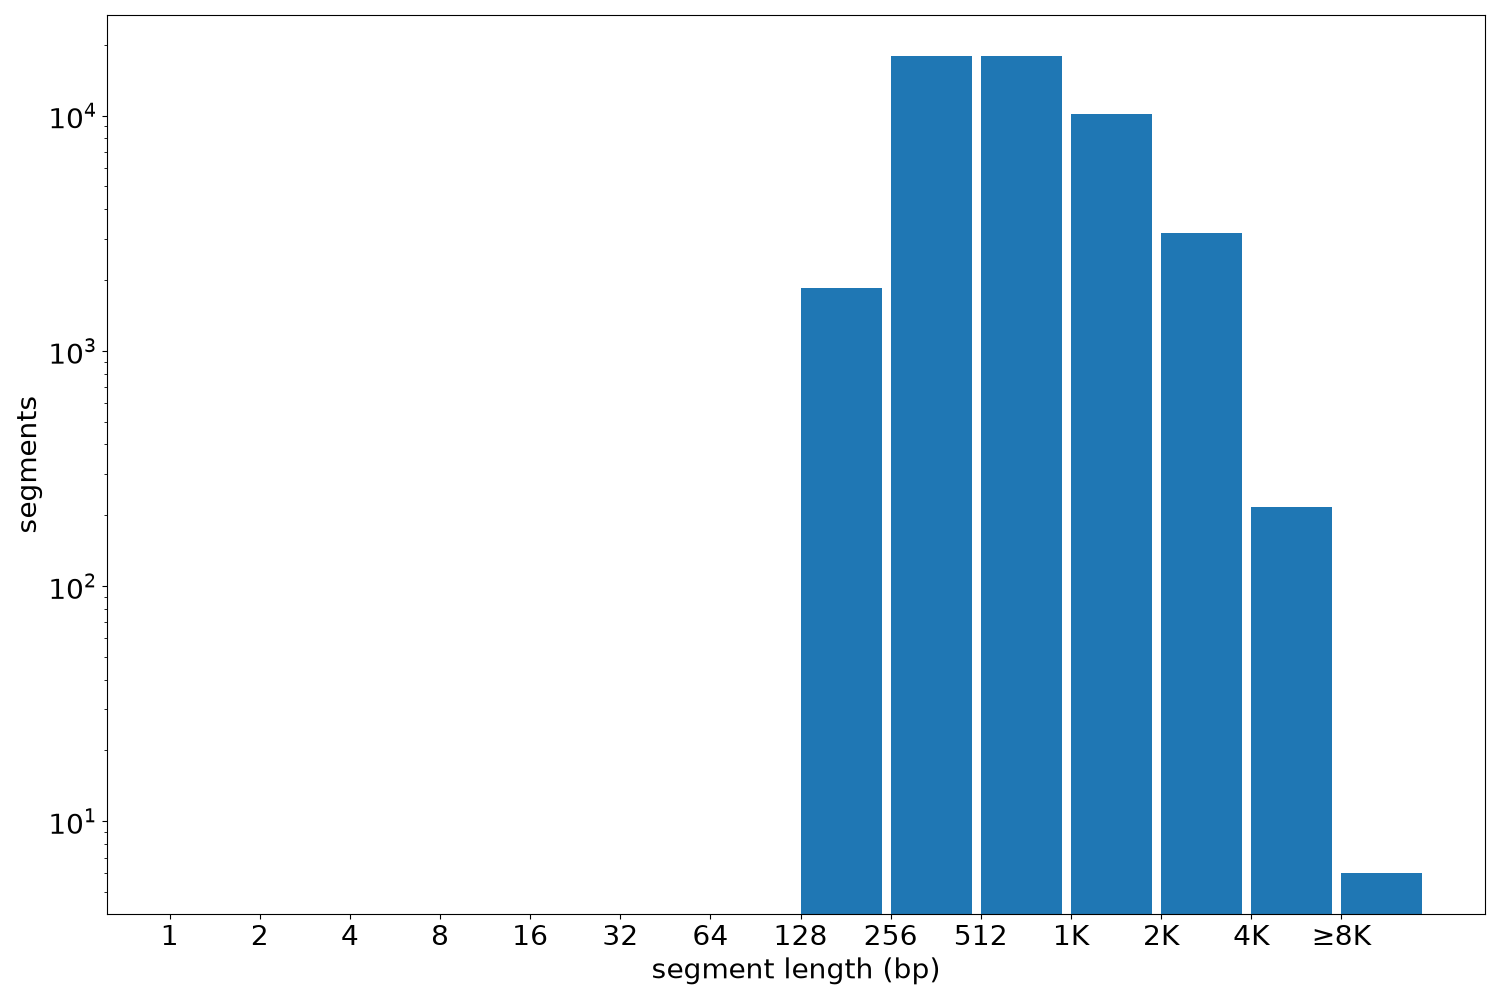
Segment lengths
| segments | min | max | mean | median | |
|---|---|---|---|---|---|
| segments | 51227 | 190 | 11907 | 860.47 | 624 |
Files
| Filename | Size | md5 |
|---|---|---|
| ENCFF171IVU.bed.gz | 1.12 MB | 2ab62f65d644eb1d6867760f3997d786 |
| ENCFF171IVU.tabix.bed.gz | 537.72 KB | 3a424150a185910b804ad24767827bc2 |
| ENCFF171IVU.tabix.bed.gz.tbi | 200.33 KB | 71ddda64b04625b9b318b948f6c98b63 |
| genomic_resource.yaml | 2.94 KB | 4a814e34707365c45a7a6ee2bec6e08a |
| statistics/ |