Resource
| Id | Histone_ChIP-seq/ENCSR910PDW |
|---|---|
| Type | position_score |
| Version | 0 |
| Summary | Histone_ChIP-seq ENCSR910PDW [biosample_summary="Homo sapiens epithelial cell of prostate male" and target="H3K27ac"] |
| Description |
status: released biological_replicates: Rep 1, Rep 2 summary: male output_type: replicated peaks audit_internal_action: Archived analysis {ENCAN208PHQ|/analyses/ENCAN208PHQ/} has in progress subobject quality standard {encode3-histone-chip|/quality-standards/encode3-histone-chip/} audit_warning: PBC1 (PCR Bottlenecking Coefficient 1, M1/M_distinct) is the ratio of the number of genomic locations where exactly one read maps uniquely (M1) to the number of genomic locations where some reads map (M_distinct). A PBC1 value in the range 0 - 0.5 is severe bottlenecking, 0.5 - 0.8 is moderate bottlenecking, 0.8 - 0.9 is mild bottlenecking, and > 0.9 is no bottlenecking. PBC1 value > 0.9 is recommended, but > 0.8 is acceptable. ENCODE processed alignments file {ENCFF175ANQ|/files/ENCFF175ANQ/} processed by ChIP-seq ENCODE3 GRCh38 pipeline was generated from a library with PBC1 value of 0.84. audit_warning: PBC2 (PCR Bottlenecking Coefficient 2, M1/M2) is the ratio of the number of genomic locations where exactly one read maps uniquely (M1) to the number of genomic locations where two reads map uniquely (M2). A PBC2 value in the range 0 - 1 is severe bottlenecking, 1 - 3 is moderate bottlenecking, 3 - 10 is mild bottlenecking, > 10 is no bottlenecking. PBC2 value > 10 is recommended, but > 3 is acceptable. ENCODE processed alignments file {ENCFF175ANQ|/files/ENCFF175ANQ/} processed by ChIP-seq ENCODE3 GRCh38 pipeline was generated from a library with PBC2 value of 6.16. |
| Labels |
|
Scores (1)
| ID | Type | Default annotation | Description | Histogram | Range | Summary |
|---|---|---|---|---|---|---|
| Histone_ChIP-seq_ENCSR910PDW | float |
Histone_ChIP-seq_ENCSR910PDW |
Histone_ChIP-seq ENCSR910PDW [biosample_summary="Homo sapiens epithelial cell of prostate male" and target="H3K27ac"]
|
 |
[1.45, 323] |
|
n counts base pairs; sd is the population standard deviation.
Coverage
| Chromosome | Covered positions | Covered % | Segments |
|---|---|---|---|
| all chromosomes | 132134850 | 4.11% | 71191 |
| chr1 | 13090313 | 5.26% | 6863 |
| chr1_KI270706v1_random | 1171 | 0.67% | 1 |
| chr1_KI270713v1_random | 2501 | 6.14% | 3 |
| chr2 | 10619679 | 4.38% | 5894 |
| chr3 | 9140456 | 4.61% | 4823 |
| chr4 | 6912781 | 3.63% | 3885 |
| chr5 | 7074299 | 3.90% | 3922 |
| chr6 | 8017313 | 4.69% | 4305 |
| chr7 | 6290248 | 3.95% | 3444 |
| chr8 | 5755275 | 3.97% | 3330 |
| chr9 | 5460542 | 3.95% | 3012 |
| chr10 | 6109130 | 4.57% | 3262 |
| chr11 | 6517847 | 4.82% | 3422 |
| chr12 | 6997585 | 5.25% | 3498 |
| chr13 | 3130981 | 2.74% | 1831 |
| chr14 | 4360700 | 4.07% | 2327 |
| chr14_GL000194v1_random | 2262 | 1.18% | 3 |
| chr15 | 4471295 | 4.38% | 2365 |
| chr16 | 4019902 | 4.45% | 2194 |
| chr17 | 5664866 | 6.80% | 2821 |
| chr17_GL000205v2_random | 7155 | 3.86% | 7 |
| chr18 | 2984058 | 3.71% | 1689 |
| chr19 | 4247226 | 7.25% | 2112 |
| chr20 | 3694258 | 5.73% | 1932 |
| chr21 | 1580007 | 3.38% | 875 |
| chr22 | 2210567 | 4.35% | 1143 |
| chr22_KI270733v1_random | 710 | 0.39% | 1 |
| chrUn_GL000195v1 | 9940 | 5.43% | 7 |
| chrUn_GL000219v1 | 2958 | 1.65% | 2 |
| chrUn_GL000220v1 | 1040 | 0.64% | 1 |
| chrUn_KI270747v1 | 349 | 0.18% | 1 |
| chrX | 3414473 | 2.19% | 2019 |
| chrY | 342963 | 0.60% | 197 |
| 3333 contigs with no values (127581822 bp) | 0 | 0.00% | 0 |
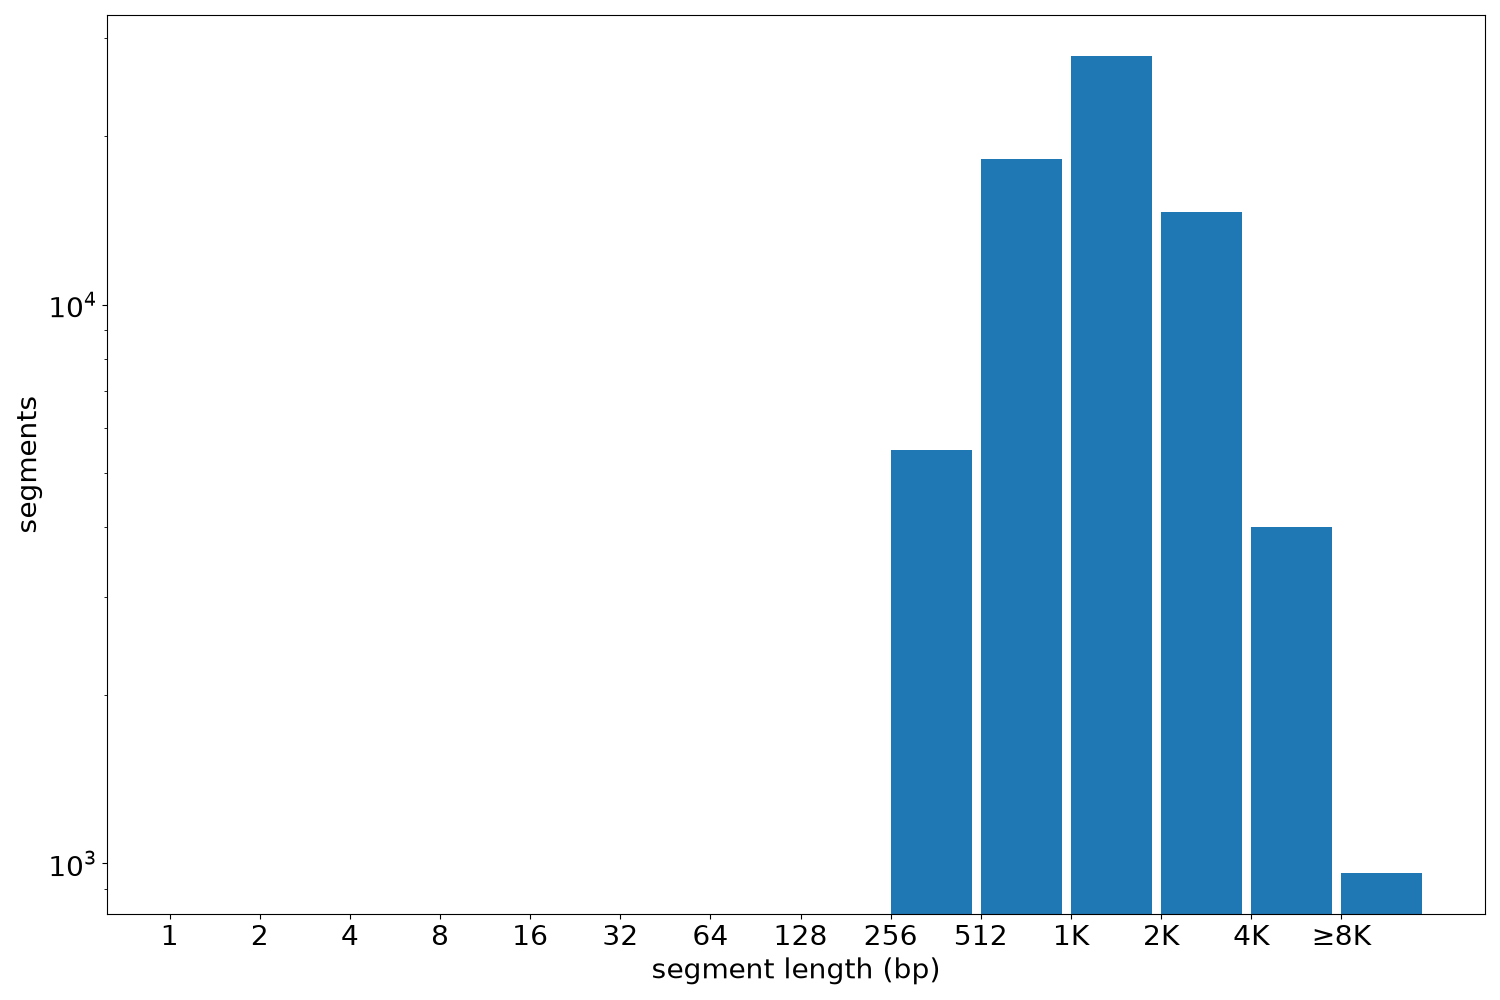
Segment lengths
| segments | min | max | mean | median | |
|---|---|---|---|---|---|
| segments | 71191 | 300 | 67685 | 1856.06 | 1361 |
Files
| Filename | Size | md5 |
|---|---|---|
| ENCFF655JIF.bed.gz | 1.96 MB | 0de08a4df96e879b2ded73f4bd78be25 |
| ENCFF655JIF.tabix.bed.gz | 830.43 KB | 83ce0759d4af62037fb2da8571c3bf8c |
| ENCFF655JIF.tabix.bed.gz.tbi | 292.99 KB | b8b0ee433ff89205b39109a343e024b6 |
| genomic_resource.yaml | 2.69 KB | f3e30ad1e1277298bb0ce98e9ca66019 |
| statistics/ |