Resource
| Id | Histone_ChIP-seq/ENCSR888WZL |
|---|---|
| Type | position_score |
| Version | 0 |
| Summary | Histone_ChIP-seq ENCSR888WZL [biosample_summary="Homo sapiens iPS DF 19.11" and target="H3K4me3"] |
| Description |
status: released biological_replicates: Rep 1, Rep 2 summary: output_type: replicated peaks audit_internal_action: Archived analysis {ENCAN819RRC|/analyses/ENCAN819RRC/} has in progress subobject quality standard {encode3-histone-chip|/quality-standards/encode3-histone-chip/} audit_warning: Processed alignments file {ENCFF532VHS|/files/ENCFF532VHS/} processed by ChIP-seq ENCODE3 hg19 pipeline has 15605486 usable fragments. The minimum ENCODE standard for each replicate in a ChIP-seq experiment targeting H3K4me3-human and investigated as a narrow histone mark is 10 million usable fragments. The recommended value is > 20 million, but > 10 million is acceptable. (See {ENCODE ChIP-seq data standards|/data-standards/chip-seq/}) audit_warning: Processed alignments file {ENCFF052TYC|/files/ENCFF052TYC/} processed by ChIP-seq ENCODE3 hg19 pipeline has 15797479 usable fragments. The minimum ENCODE standard for each replicate in a ChIP-seq experiment targeting H3K4me3-human and investigated as a narrow histone mark is 10 million usable fragments. The recommended value is > 20 million, but > 10 million is acceptable. (See {ENCODE ChIP-seq data standards|/data-standards/chip-seq/}) audit_warning: PBC1 (PCR Bottlenecking Coefficient 1, M1/M_distinct) is the ratio of the number of genomic locations where exactly one read maps uniquely (M1) to the number of genomic locations where some reads map (M_distinct). A PBC1 value in the range 0 - 0.5 is severe bottlenecking, 0.5 - 0.8 is moderate bottlenecking, 0.8 - 0.9 is mild bottlenecking, and > 0.9 is no bottlenecking. PBC1 value > 0.9 is recommended, but > 0.8 is acceptable. ENCODE processed alignments file {ENCFF532VHS|/files/ENCFF532VHS/} processed by ChIP-seq ENCODE3 hg19 pipeline was generated from a library with PBC1 value of 0.88. audit_warning: PBC2 (PCR Bottlenecking Coefficient 2, M1/M2) is the ratio of the number of genomic locations where exactly one read maps uniquely (M1) to the number of genomic locations where two reads map uniquely (M2). A PBC2 value in the range 0 - 1 is severe bottlenecking, 1 - 3 is moderate bottlenecking, 3 - 10 is mild bottlenecking, > 10 is no bottlenecking. PBC2 value > 10 is recommended, but > 3 is acceptable. ENCODE processed alignments file {ENCFF532VHS|/files/ENCFF532VHS/} processed by ChIP-seq ENCODE3 hg19 pipeline was generated from a library with PBC2 value of 9.36. audit_warning: PBC1 (PCR Bottlenecking Coefficient 1, M1/M_distinct) is the ratio of the number of genomic locations where exactly one read maps uniquely (M1) to the number of genomic locations where some reads map (M_distinct). A PBC1 value in the range 0 - 0.5 is severe bottlenecking, 0.5 - 0.8 is moderate bottlenecking, 0.8 - 0.9 is mild bottlenecking, and > 0.9 is no bottlenecking. PBC1 value > 0.9 is recommended, but > 0.8 is acceptable. ENCODE processed alignments file {ENCFF052TYC|/files/ENCFF052TYC/} processed by ChIP-seq ENCODE3 hg19 pipeline was generated from a library with PBC1 value of 0.90. |
| Labels |
|
Scores (1)
| ID | Type | Default annotation | Description | Histogram | Range | Summary |
|---|---|---|---|---|---|---|
| Histone_ChIP-seq_ENCSR888WZL | float |
Histone_ChIP-seq_ENCSR888WZL |
Histone_ChIP-seq ENCSR888WZL [biosample_summary="Homo sapiens iPS DF 19.11" and target="H3K4me3"]
|
 |
[1.29, 99] |
|
n counts base pairs; sd is the population standard deviation.
Coverage
| Chromosome | Covered positions | Covered % | Segments |
|---|---|---|---|
| all chromosomes | 31631526 | 0.98% | 44383 |
| chr1 | 3044589 | 1.22% | 4218 |
| chr2 | 2087804 | 0.86% | 2896 |
| chr3 | 1610315 | 0.81% | 2030 |
| chr4 | 1189008 | 0.63% | 1555 |
| chr5 | 1437615 | 0.79% | 1935 |
| chr6 | 1767120 | 1.03% | 2284 |
| chr7 | 1510868 | 0.95% | 2251 |
| chr8 | 1187746 | 0.82% | 1599 |
| chr9 | 1337601 | 0.97% | 1939 |
| chr10 | 1315673 | 0.98% | 1851 |
| chr11 | 1753631 | 1.30% | 2465 |
| chr12 | 1533733 | 1.15% | 2037 |
| chr13 | 612048 | 0.54% | 805 |
| chr14 | 1034209 | 0.97% | 1371 |
| chr15 | 996931 | 0.98% | 1356 |
| chr16 | 1376485 | 1.52% | 2059 |
| chr17 | 1927756 | 2.32% | 2746 |
| chr18 | 528839 | 0.66% | 665 |
| chr19 | 2389936 | 4.08% | 3760 |
| chr20 | 932054 | 1.45% | 1350 |
| chr21 | 331682 | 0.71% | 561 |
| chr22 | 761401 | 1.50% | 1315 |
| chrX | 931195 | 0.60% | 1280 |
| chrY | 33287 | 0.06% | 55 |
| 3342 contigs with no values (129077085 bp) | 0 | 0.00% | 0 |
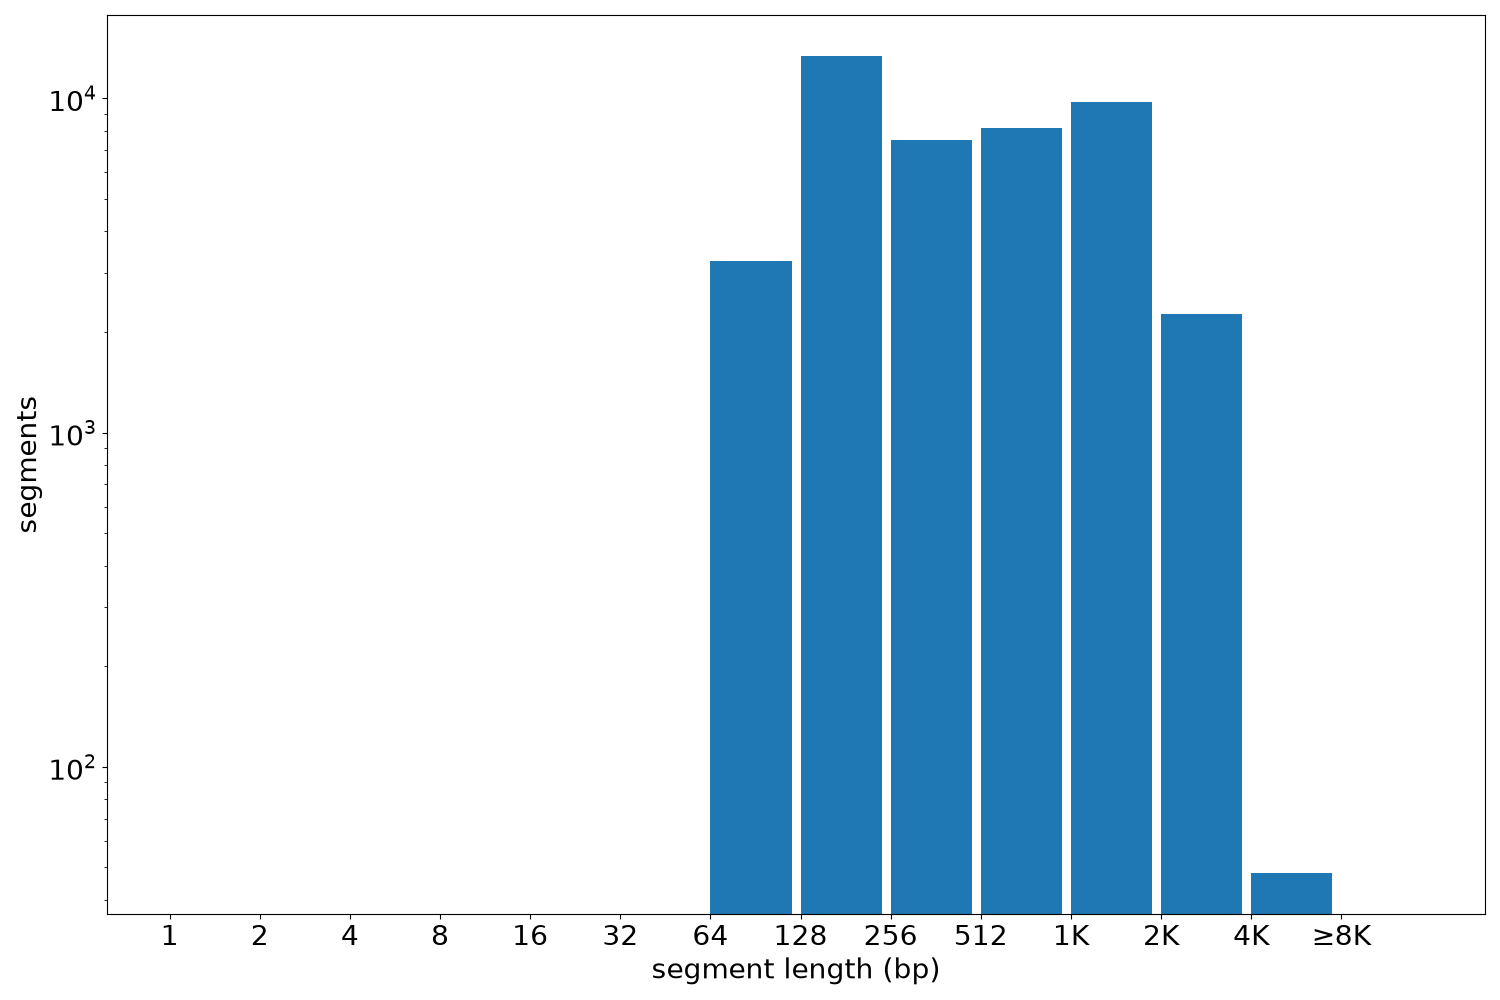
Segment lengths
| segments | min | max | mean | median | |
|---|---|---|---|---|---|
| segments | 44383 | 120 | 6334 | 712.69 | 417 |
Files
| Filename | Size | md5 |
|---|---|---|
| ENCFF538JKF.bed.gz | 1.01 MB | f1673e115f18adacc2237572ff10a4cf |
| ENCFF538JKF.tabix.bed.gz | 471.05 KB | 08ebab1a14ca9cc7df62c8328454bf34 |
| ENCFF538JKF.tabix.bed.gz.tbi | 192.11 KB | 8420792b4c5a1f87d8c1168e36cc339c |
| genomic_resource.yaml | 4.34 KB | 676c1953dd04a61812f3e145a5d17698 |
| statistics/ |