Resource
| Id | Histone_ChIP-seq/ENCSR883XRM |
|---|---|
| Type | position_score |
| Version | 0 |
| Summary | Histone_ChIP-seq ENCSR883XRM [biosample_summary="Homo sapiens hepatocyte originated from H9" and target="H2AFZ"] |
| Description |
status: released biological_replicates: Rep 1, Rep 2 summary: female embryo (5 days) output_type: replicated peaks audit_internal_action: Archived analysis {ENCAN482UAH|/analyses/ENCAN482UAH/} has in progress subobject quality standard {encode3-histone-chip|/quality-standards/encode3-histone-chip/} audit_warning: PBC1 (PCR Bottlenecking Coefficient 1, M1/M_distinct) is the ratio of the number of genomic locations where exactly one read maps uniquely (M1) to the number of genomic locations where some reads map (M_distinct). A PBC1 value in the range 0 - 0.5 is severe bottlenecking, 0.5 - 0.8 is moderate bottlenecking, 0.8 - 0.9 is mild bottlenecking, and > 0.9 is no bottlenecking. PBC1 value > 0.9 is recommended, but > 0.8 is acceptable. ENCODE processed alignments file {ENCFF837ETW|/files/ENCFF837ETW/} processed by ChIP-seq ENCODE3 hg19 pipeline was generated from a library with PBC1 value of 0.88. audit_warning: PBC2 (PCR Bottlenecking Coefficient 2, M1/M2) is the ratio of the number of genomic locations where exactly one read maps uniquely (M1) to the number of genomic locations where two reads map uniquely (M2). A PBC2 value in the range 0 - 1 is severe bottlenecking, 1 - 3 is moderate bottlenecking, 3 - 10 is mild bottlenecking, > 10 is no bottlenecking. PBC2 value > 10 is recommended, but > 3 is acceptable. ENCODE processed alignments file {ENCFF837ETW|/files/ENCFF837ETW/} processed by ChIP-seq ENCODE3 hg19 pipeline was generated from a library with PBC2 value of 8.50. |
| Labels |
|
Scores (1)
| ID | Type | Default annotation | Description | Histogram | Range | Summary |
|---|---|---|---|---|---|---|
| Histone_ChIP-seq_ENCSR883XRM | float |
Histone_ChIP-seq_ENCSR883XRM |
Histone_ChIP-seq ENCSR883XRM [biosample_summary="Homo sapiens hepatocyte originated from H9" and target="H2AFZ"]
|
 |
[1.14, 14.7] |
|
n counts base pairs; sd is the population standard deviation.
Coverage
| Chromosome | Covered positions | Covered % | Segments |
|---|---|---|---|
| all chromosomes | 34885746 | 1.08% | 48015 |
| chr1 | 3311873 | 1.33% | 4499 |
| chr2 | 2636310 | 1.09% | 3596 |
| chr3 | 2177689 | 1.10% | 2980 |
| chr4 | 1903844 | 1.00% | 2592 |
| chr5 | 1883293 | 1.04% | 2576 |
| chr6 | 2346651 | 1.37% | 3064 |
| chr7 | 1748733 | 1.10% | 2438 |
| chr8 | 1457900 | 1.00% | 1994 |
| chr9 | 1378758 | 1.00% | 1913 |
| chr10 | 1550923 | 1.16% | 2097 |
| chr11 | 1685220 | 1.25% | 2277 |
| chr12 | 1840713 | 1.38% | 2485 |
| chr13 | 989618 | 0.87% | 1408 |
| chr14 | 1219943 | 1.14% | 1609 |
| chr15 | 1108407 | 1.09% | 1447 |
| chr16 | 1041981 | 1.15% | 1520 |
| chr17 | 1551241 | 1.86% | 2159 |
| chr18 | 750942 | 0.93% | 1070 |
| chr19 | 1514778 | 2.58% | 2228 |
| chr20 | 848460 | 1.32% | 1201 |
| chr21 | 378401 | 0.81% | 548 |
| chr22 | 557725 | 1.10% | 820 |
| chrM | 8805 | 53.14% | 7 |
| chrX | 993260 | 0.64% | 1486 |
| chrY | 278 | <0.01% | 1 |
| 3341 contigs with no values (129060516 bp) | 0 | 0.00% | 0 |
Segment lengths
| segments | min | max | mean | median | |
|---|---|---|---|---|---|
| segments | 48015 | 185 | 5743 | 726.56 | 602 |
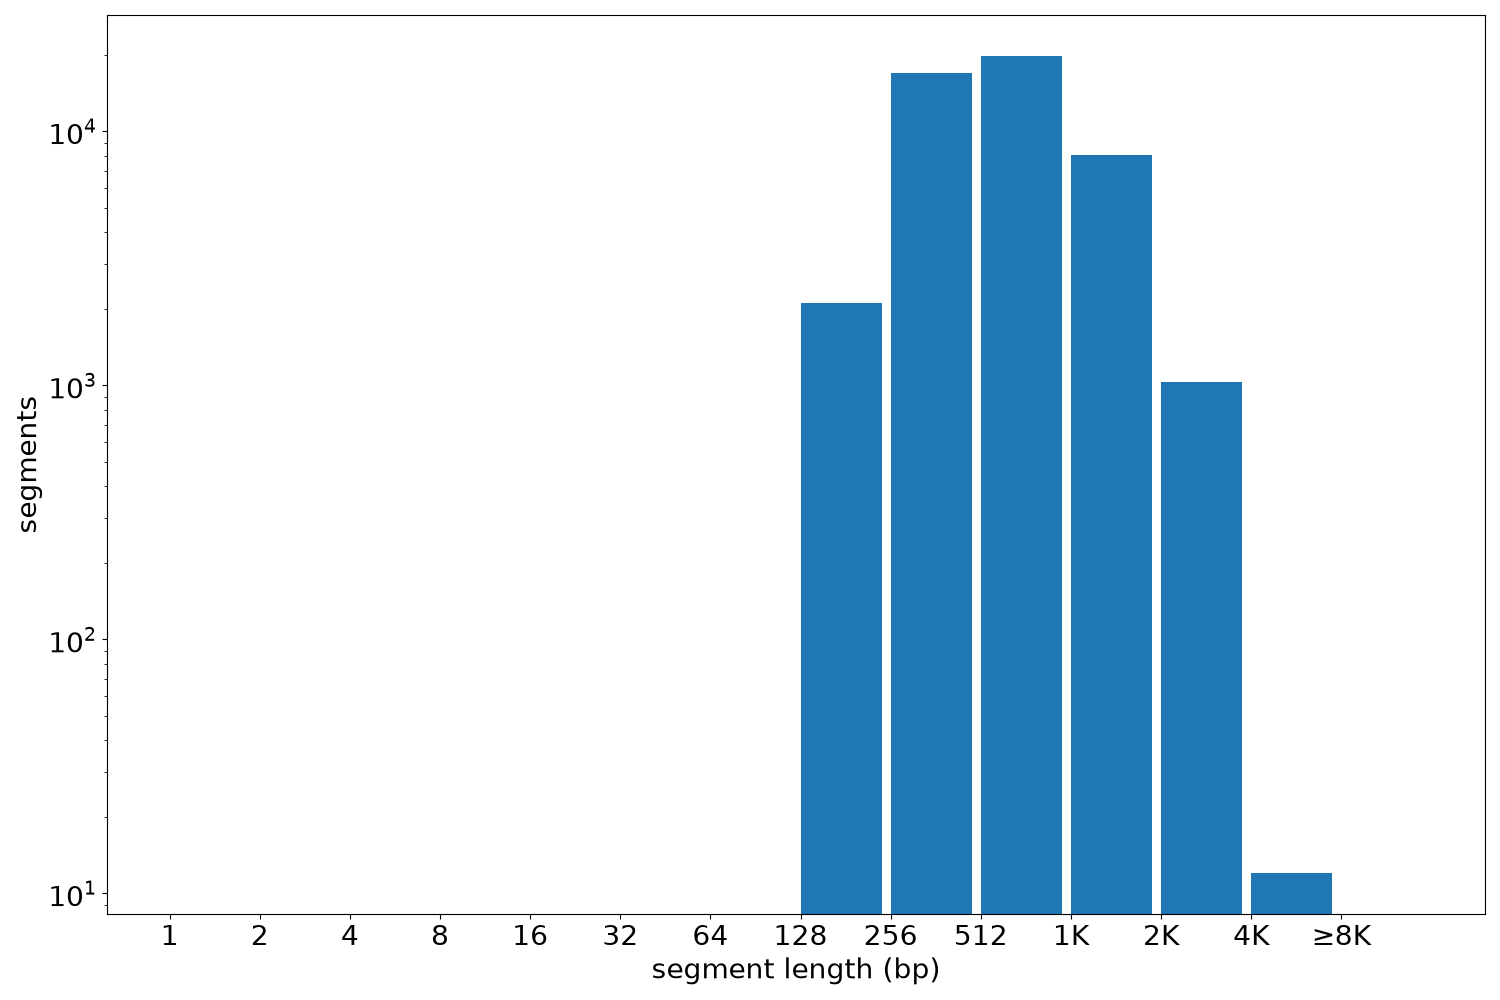
Files
| Filename | Size | md5 |
|---|---|---|
| ENCFF987QKQ.bed.gz | 1.2 MB | de06a78e5c39ba918de8f61e81659cbd |
| ENCFF987QKQ.tabix.bed.gz | 528.45 KB | 039fa66e9ae81cae412958d2b5c128c2 |
| ENCFF987QKQ.tabix.bed.gz.tbi | 243.45 KB | 3287957bab58ef3acb37cdec291a1d23 |
| genomic_resource.yaml | 2.73 KB | 81ff0f140a0be07bb6bf1bdd2f89ad63 |
| statistics/ |