Resource
| Id | Histone_ChIP-seq/ENCSR866KFY |
|---|---|
| Type | position_score |
| Version | 0 |
| Summary | Histone_ChIP-seq ENCSR866KFY [biosample_summary="Homo sapiens GM23248" and target="H3K27me3"] |
| Description |
status: released biological_replicates: Rep 1, Rep 2 summary: output_type: replicated peaks audit_internal_action: Archived analysis {ENCAN646SHM|/analyses/ENCAN646SHM/} has in progress subobject quality standard {encode3-histone-chip|/quality-standards/encode3-histone-chip/} audit_not_compliant: Processed alignments file {ENCFF122SGX|/files/ENCFF122SGX/} processed by ChIP-seq ENCODE3 GRCh38 pipeline has 32287940 usable fragments. The minimum ENCODE standard for each replicate in a ChIP-seq experiment targeting H3K27me3-human and investigated as a broad histone mark is 20 million usable fragments. The recommended value is > 45 million, but > 35 million is acceptable. (See {ENCODE ChIP-seq data standards|/data-standards/chip-seq/}) audit_not_compliant: Processed alignments file {ENCFF943RTB|/files/ENCFF943RTB/} processed by ChIP-seq ENCODE3 GRCh38 pipeline has 33129669 usable fragments. The minimum ENCODE standard for each replicate in a ChIP-seq experiment targeting H3K27me3-human and investigated as a broad histone mark is 20 million usable fragments. The recommended value is > 45 million, but > 35 million is acceptable. (See {ENCODE ChIP-seq data standards|/data-standards/chip-seq/}) audit_warning: PBC1 (PCR Bottlenecking Coefficient 1, M1/M_distinct) is the ratio of the number of genomic locations where exactly one read maps uniquely (M1) to the number of genomic locations where some reads map (M_distinct). A PBC1 value in the range 0 - 0.5 is severe bottlenecking, 0.5 - 0.8 is moderate bottlenecking, 0.8 - 0.9 is mild bottlenecking, and > 0.9 is no bottlenecking. PBC1 value > 0.9 is recommended, but > 0.8 is acceptable. ENCODE processed alignments file {ENCFF122SGX|/files/ENCFF122SGX/} processed by ChIP-seq ENCODE3 GRCh38 pipeline was generated from a library with PBC1 value of 0.83. audit_warning: PBC2 (PCR Bottlenecking Coefficient 2, M1/M2) is the ratio of the number of genomic locations where exactly one read maps uniquely (M1) to the number of genomic locations where two reads map uniquely (M2). A PBC2 value in the range 0 - 1 is severe bottlenecking, 1 - 3 is moderate bottlenecking, 3 - 10 is mild bottlenecking, > 10 is no bottlenecking. PBC2 value > 10 is recommended, but > 3 is acceptable. ENCODE processed alignments file {ENCFF122SGX|/files/ENCFF122SGX/} processed by ChIP-seq ENCODE3 GRCh38 pipeline was generated from a library with PBC2 value of 5.66. audit_warning: PBC1 (PCR Bottlenecking Coefficient 1, M1/M_distinct) is the ratio of the number of genomic locations where exactly one read maps uniquely (M1) to the number of genomic locations where some reads map (M_distinct). A PBC1 value in the range 0 - 0.5 is severe bottlenecking, 0.5 - 0.8 is moderate bottlenecking, 0.8 - 0.9 is mild bottlenecking, and > 0.9 is no bottlenecking. PBC1 value > 0.9 is recommended, but > 0.8 is acceptable. ENCODE processed alignments file {ENCFF943RTB|/files/ENCFF943RTB/} processed by ChIP-seq ENCODE3 GRCh38 pipeline was generated from a library with PBC1 value of 0.88. audit_warning: PBC2 (PCR Bottlenecking Coefficient 2, M1/M2) is the ratio of the number of genomic locations where exactly one read maps uniquely (M1) to the number of genomic locations where two reads map uniquely (M2). A PBC2 value in the range 0 - 1 is severe bottlenecking, 1 - 3 is moderate bottlenecking, 3 - 10 is mild bottlenecking, > 10 is no bottlenecking. PBC2 value > 10 is recommended, but > 3 is acceptable. ENCODE processed alignments file {ENCFF943RTB|/files/ENCFF943RTB/} processed by ChIP-seq ENCODE3 GRCh38 pipeline was generated from a library with PBC2 value of 8.02. |
| Labels |
|
Scores (1)
| ID | Type | Default annotation | Description | Histogram | Range | Summary |
|---|---|---|---|---|---|---|
| Histone_ChIP-seq_ENCSR866KFY | float |
Histone_ChIP-seq_ENCSR866KFY |
Histone_ChIP-seq ENCSR866KFY [biosample_summary="Homo sapiens GM23248" and target="H3K27me3"]
|
 |
[1.34, 9.3] |
|
n counts base pairs; sd is the population standard deviation.
Coverage
| Chromosome | Covered positions | Covered % | Segments |
|---|---|---|---|
| all chromosomes | 77591501 | 2.41% | 87763 |
| chr1 | 6880260 | 2.76% | 7734 |
| chr1_KI270712v1_random | 747 | 0.42% | 2 |
| chr1_KI270713v1_random | 3217 | 7.90% | 6 |
| chr2 | 6122548 | 2.53% | 6977 |
| chr3 | 4744780 | 2.39% | 5622 |
| chr4 | 3791830 | 1.99% | 4466 |
| chr5 | 4742232 | 2.61% | 5505 |
| chr6 | 3707053 | 2.17% | 4148 |
| chr7 | 3411105 | 2.14% | 3848 |
| chr8 | 3372659 | 2.32% | 4000 |
| chr9 | 3698476 | 2.67% | 4143 |
| chr10 | 4754161 | 3.55% | 5285 |
| chr11 | 5774473 | 4.27% | 6385 |
| chr12 | 3462932 | 2.60% | 3906 |
| chr13 | 2456869 | 2.15% | 2785 |
| chr14 | 2666506 | 2.49% | 2997 |
| chr15 | 2902647 | 2.85% | 3184 |
| chr16 | 2122327 | 2.35% | 2338 |
| chr17 | 3273444 | 3.93% | 3462 |
| chr17_GL000205v2_random | 15301 | 8.24% | 18 |
| chr18 | 1825428 | 2.27% | 2203 |
| chr19 | 2008453 | 3.43% | 2238 |
| chr20 | 3313409 | 5.14% | 3691 |
| chr21 | 875210 | 1.87% | 971 |
| chr22 | 1524592 | 3.00% | 1657 |
| chr22_KI270733v1_random | 5695 | 3.17% | 9 |
| chrUn_GL000219v1 | 2313 | 1.29% | 4 |
| chrUn_KI270337v1 | 645 | 57.54% | 1 |
| chrUn_KI270438v1 | 2131 | 1.89% | 5 |
| chrUn_KI270466v1 | 859 | 69.67% | 2 |
| chrUn_KI270467v1 | 1563 | 39.87% | 1 |
| chrX | 127213 | 0.08% | 169 |
| chrY | 423 | <0.01% | 1 |
| 3333 contigs with no values (128196957 bp) | 0 | 0.00% | 0 |
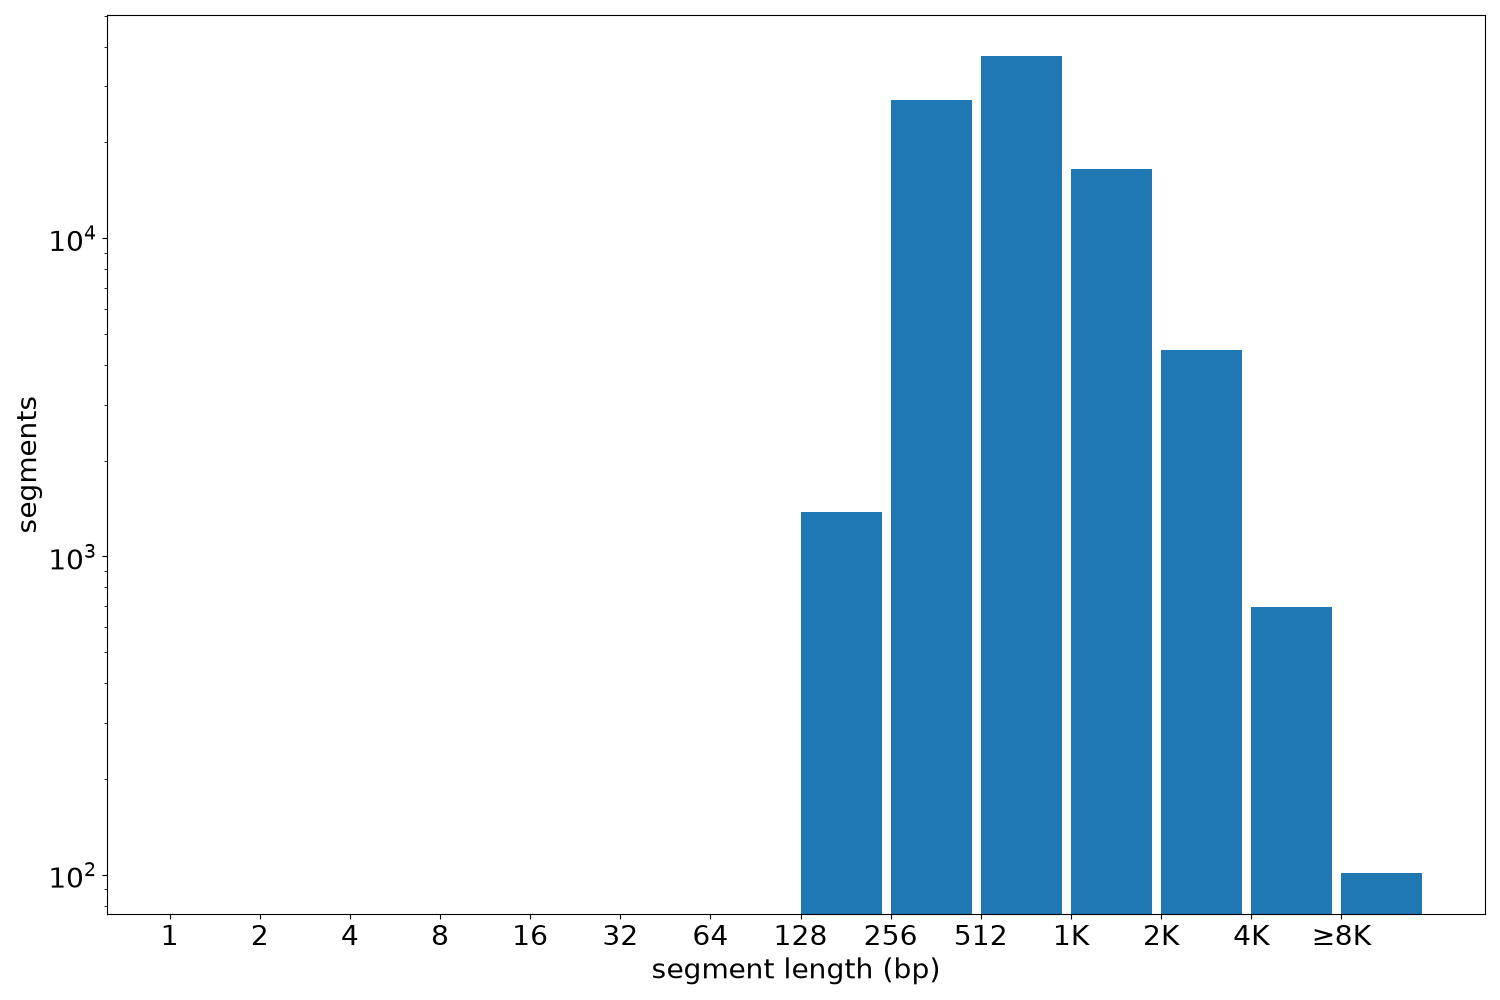
Segment lengths
| segments | min | max | mean | median | |
|---|---|---|---|---|---|
| segments | 87763 | 195 | 20802 | 884.1 | 662 |
Files
| Filename | Size | md5 |
|---|---|---|
| ENCFF272UZC.bed.gz | 1.68 MB | 415f9fb18ab0186089eb9135d40796d9 |
| ENCFF272UZC.tabix.bed.gz | 863.06 KB | d5675370289ccefd4ff14e667b140670 |
| ENCFF272UZC.tabix.bed.gz.tbi | 188.92 KB | 3b6e0d74b88aca82d7078f90d8452069 |
| genomic_resource.yaml | 5.67 KB | 216cc78d74531886d1c1946cfc926acf |
| statistics/ |