Resource
| Id | Histone_ChIP-seq/ENCSR806XIU |
|---|---|
| Type | position_score |
| Version | 0 |
| Summary | Histone_ChIP-seq ENCSR806XIU [biosample_summary="Homo sapiens KMS-11" and target="H3K4me2"] |
| Description |
status: released biological_replicates: Rep 1, Rep 2 summary: output_type: pseudoreplicated peaks audit_internal_action: Released analysis {ENCAN978BZK|/analyses/ENCAN978BZK/} has in progress subobject quality standard {encode4-histone-chip|/quality-standards/encode4-histone-chip/} audit_warning: PBC1 (PCR Bottlenecking Coefficient 1, M1/M_distinct) is the ratio of the number of genomic locations where exactly one read maps uniquely (M1) to the number of genomic locations where some reads map (M_distinct). A PBC1 value in the range 0 - 0.5 is severe bottlenecking, 0.5 - 0.8 is moderate bottlenecking, 0.8 - 0.9 is mild bottlenecking, and > 0.9 is no bottlenecking. PBC1 value > 0.9 is recommended, but > 0.8 is acceptable. ENCODE processed alignments file {ENCFF875DBI|/files/ENCFF875DBI/} processed by ChIP-seq ENCODE4 v1.7.0 GRCh38 pipeline was generated from a library with PBC1 value of 0.88. audit_warning: PBC2 (PCR Bottlenecking Coefficient 2, M1/M2) is the ratio of the number of genomic locations where exactly one read maps uniquely (M1) to the number of genomic locations where two reads map uniquely (M2). A PBC2 value in the range 0 - 1 is severe bottlenecking, 1 - 3 is moderate bottlenecking, 3 - 10 is mild bottlenecking, > 10 is no bottlenecking. PBC2 value > 10 is recommended, but > 3 is acceptable. ENCODE processed alignments file {ENCFF875DBI|/files/ENCFF875DBI/} processed by ChIP-seq ENCODE4 v1.7.0 GRCh38 pipeline was generated from a library with PBC2 value of 8.33. |
| Labels |
|
Scores (1)
| ID | Type | Default annotation | Description | Histogram | Range | Summary |
|---|---|---|---|---|---|---|
| Histone_ChIP-seq_ENCSR806XIU | float |
Histone_ChIP-seq_ENCSR806XIU |
Histone_ChIP-seq ENCSR806XIU [biosample_summary="Homo sapiens KMS-11" and target="H3K4me2"]
|
 |
[1.64, 14.8] |
|
n counts base pairs; sd is the population standard deviation.
Coverage
| Chromosome | Covered positions | Covered % | Segments |
|---|---|---|---|
| all chromosomes | 92838836 | 2.89% | 63461 |
| chr1 | 9065105 | 3.64% | 6059 |
| chr2 | 7522644 | 3.11% | 4942 |
| chr3 | 5684140 | 2.87% | 3890 |
| chr4 | 4750341 | 2.50% | 3203 |
| chr5 | 5531481 | 3.05% | 3588 |
| chr6 | 5849102 | 3.42% | 3941 |
| chr7 | 5453642 | 3.42% | 3514 |
| chr8 | 4506536 | 3.10% | 2926 |
| chr9 | 3991578 | 2.88% | 2741 |
| chr10 | 4177800 | 3.12% | 2777 |
| chr11 | 4385683 | 3.25% | 3060 |
| chr12 | 4679737 | 3.51% | 3140 |
| chr13 | 1745649 | 1.53% | 1411 |
| chr14 | 2500611 | 2.34% | 1951 |
| chr15 | 3137224 | 3.08% | 2134 |
| chr16 | 2948314 | 3.26% | 2034 |
| chr17 | 4075036 | 4.89% | 2748 |
| chr18 | 2284434 | 2.84% | 1482 |
| chr19 | 2802161 | 4.78% | 2242 |
| chr20 | 2506099 | 3.89% | 1710 |
| chr21 | 968934 | 2.07% | 625 |
| chr22 | 1591023 | 3.13% | 1134 |
| chrX | 2681562 | 1.72% | 2209 |
| 3343 contigs with no values (186304500 bp) | 0 | 0.00% | 0 |
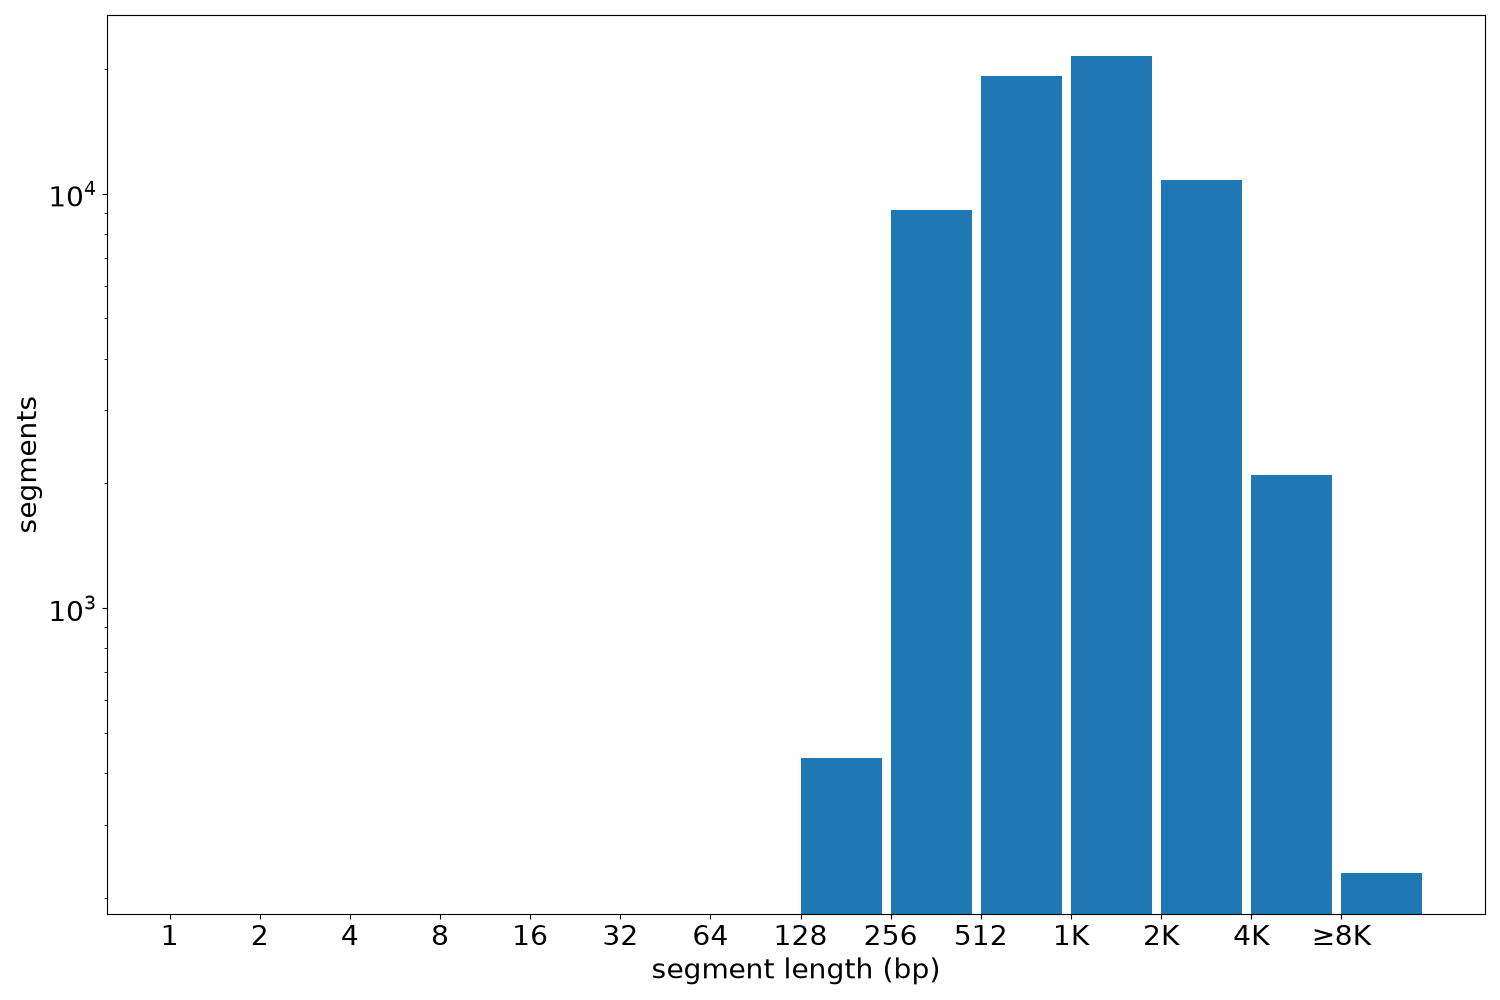
Segment lengths
| segments | min | max | mean | median | |
|---|---|---|---|---|---|
| segments | 63461 | 203 | 30449 | 1462.93 | 1118 |
Files
| Filename | Size | md5 |
|---|---|---|
| ENCFF109DRH.bed.gz | 1.55 MB | a6905d417cceb96c6bdc09a6ca9d0a53 |
| ENCFF109DRH.tabix.bed.gz | 694.26 KB | f1729643186ca81e8dabaf818a276e3b |
| ENCFF109DRH.tabix.bed.gz.tbi | 253.25 KB | 296968f2f8385b4d73e9e0ab1e1ba6fc |
| genomic_resource.yaml | 2.69 KB | 1f13abdefdeaaefdf6c66ed5c4011141 |
| statistics/ |