Resource
| Id | Histone_ChIP-seq/ENCSR780XZD |
|---|---|
| Type | position_score |
| Version | 0 |
| Summary | Histone_ChIP-seq ENCSR780XZD [biosample_summary="Homo sapiens BE2C" and target="H3K27me3"] |
| Description |
status: released biological_replicates: Rep 1, Rep 2 summary: output_type: pseudoreplicated peaks audit_internal_action: Released analysis {ENCAN398BZU|/analyses/ENCAN398BZU/} has in progress subobject quality standard {encode4-histone-chip|/quality-standards/encode4-histone-chip/} audit_warning: PBC1 (PCR Bottlenecking Coefficient 1, M1/M_distinct) is the ratio of the number of genomic locations where exactly one read maps uniquely (M1) to the number of genomic locations where some reads map (M_distinct). A PBC1 value in the range 0 - 0.5 is severe bottlenecking, 0.5 - 0.8 is moderate bottlenecking, 0.8 - 0.9 is mild bottlenecking, and > 0.9 is no bottlenecking. PBC1 value > 0.9 is recommended, but > 0.8 is acceptable. ENCODE processed alignments file {ENCFF598CZS|/files/ENCFF598CZS/} processed by ChIP-seq ENCODE4 v1.5.1 GRCh38 pipeline was generated from a library with PBC1 value of 0.86. audit_warning: PBC2 (PCR Bottlenecking Coefficient 2, M1/M2) is the ratio of the number of genomic locations where exactly one read maps uniquely (M1) to the number of genomic locations where two reads map uniquely (M2). A PBC2 value in the range 0 - 1 is severe bottlenecking, 1 - 3 is moderate bottlenecking, 3 - 10 is mild bottlenecking, > 10 is no bottlenecking. PBC2 value > 10 is recommended, but > 3 is acceptable. ENCODE processed alignments file {ENCFF598CZS|/files/ENCFF598CZS/} processed by ChIP-seq ENCODE4 v1.5.1 GRCh38 pipeline was generated from a library with PBC2 value of 7.23. audit_warning: PBC1 (PCR Bottlenecking Coefficient 1, M1/M_distinct) is the ratio of the number of genomic locations where exactly one read maps uniquely (M1) to the number of genomic locations where some reads map (M_distinct). A PBC1 value in the range 0 - 0.5 is severe bottlenecking, 0.5 - 0.8 is moderate bottlenecking, 0.8 - 0.9 is mild bottlenecking, and > 0.9 is no bottlenecking. PBC1 value > 0.9 is recommended, but > 0.8 is acceptable. ENCODE processed alignments file {ENCFF520FHH|/files/ENCFF520FHH/} processed by ChIP-seq ENCODE4 v1.5.1 GRCh38 pipeline was generated from a library with PBC1 value of 0.86. audit_warning: PBC2 (PCR Bottlenecking Coefficient 2, M1/M2) is the ratio of the number of genomic locations where exactly one read maps uniquely (M1) to the number of genomic locations where two reads map uniquely (M2). A PBC2 value in the range 0 - 1 is severe bottlenecking, 1 - 3 is moderate bottlenecking, 3 - 10 is mild bottlenecking, > 10 is no bottlenecking. PBC2 value > 10 is recommended, but > 3 is acceptable. ENCODE processed alignments file {ENCFF520FHH|/files/ENCFF520FHH/} processed by ChIP-seq ENCODE4 v1.5.1 GRCh38 pipeline was generated from a library with PBC2 value of 6.93. |
| Labels |
|
Scores (1)
| ID | Type | Default annotation | Description | Histogram | Range | Summary |
|---|---|---|---|---|---|---|
| Histone_ChIP-seq_ENCSR780XZD | float |
Histone_ChIP-seq_ENCSR780XZD |
Histone_ChIP-seq ENCSR780XZD [biosample_summary="Homo sapiens BE2C" and target="H3K27me3"]
|
 |
[1.06, 16.7] |
|
n counts base pairs; sd is the population standard deviation.
Coverage
| Chromosome | Covered positions | Covered % | Segments |
|---|---|---|---|
| all chromosomes | 48154081 | 1.50% | 53889 |
| chr1 | 3157013 | 1.27% | 3639 |
| chr2 | 1956636 | 0.81% | 2117 |
| chr3 | 2091727 | 1.05% | 2673 |
| chr4 | 2058003 | 1.08% | 2433 |
| chr5 | 3289244 | 1.81% | 3863 |
| chr6 | 3560092 | 2.08% | 4038 |
| chr7 | 3453930 | 2.17% | 3779 |
| chr8 | 2860730 | 1.97% | 3439 |
| chr9 | 1573948 | 1.14% | 1819 |
| chr10 | 1668744 | 1.25% | 1844 |
| chr11 | 1918697 | 1.42% | 2104 |
| chr12 | 3646434 | 2.74% | 4235 |
| chr13 | 2371036 | 2.07% | 2683 |
| chr14 | 2215194 | 2.07% | 2620 |
| chr15 | 1983448 | 1.94% | 2263 |
| chr16 | 1637161 | 1.81% | 1593 |
| chr17 | 3071618 | 3.69% | 2621 |
| chr18 | 324344 | 0.40% | 338 |
| chr19 | 2058635 | 3.51% | 2160 |
| chr20 | 1688942 | 2.62% | 1943 |
| chr21 | 584724 | 1.25% | 624 |
| chr22 | 745738 | 1.47% | 826 |
| chrX | 238043 | 0.15% | 235 |
| 3343 contigs with no values (186304500 bp) | 0 | 0.00% | 0 |
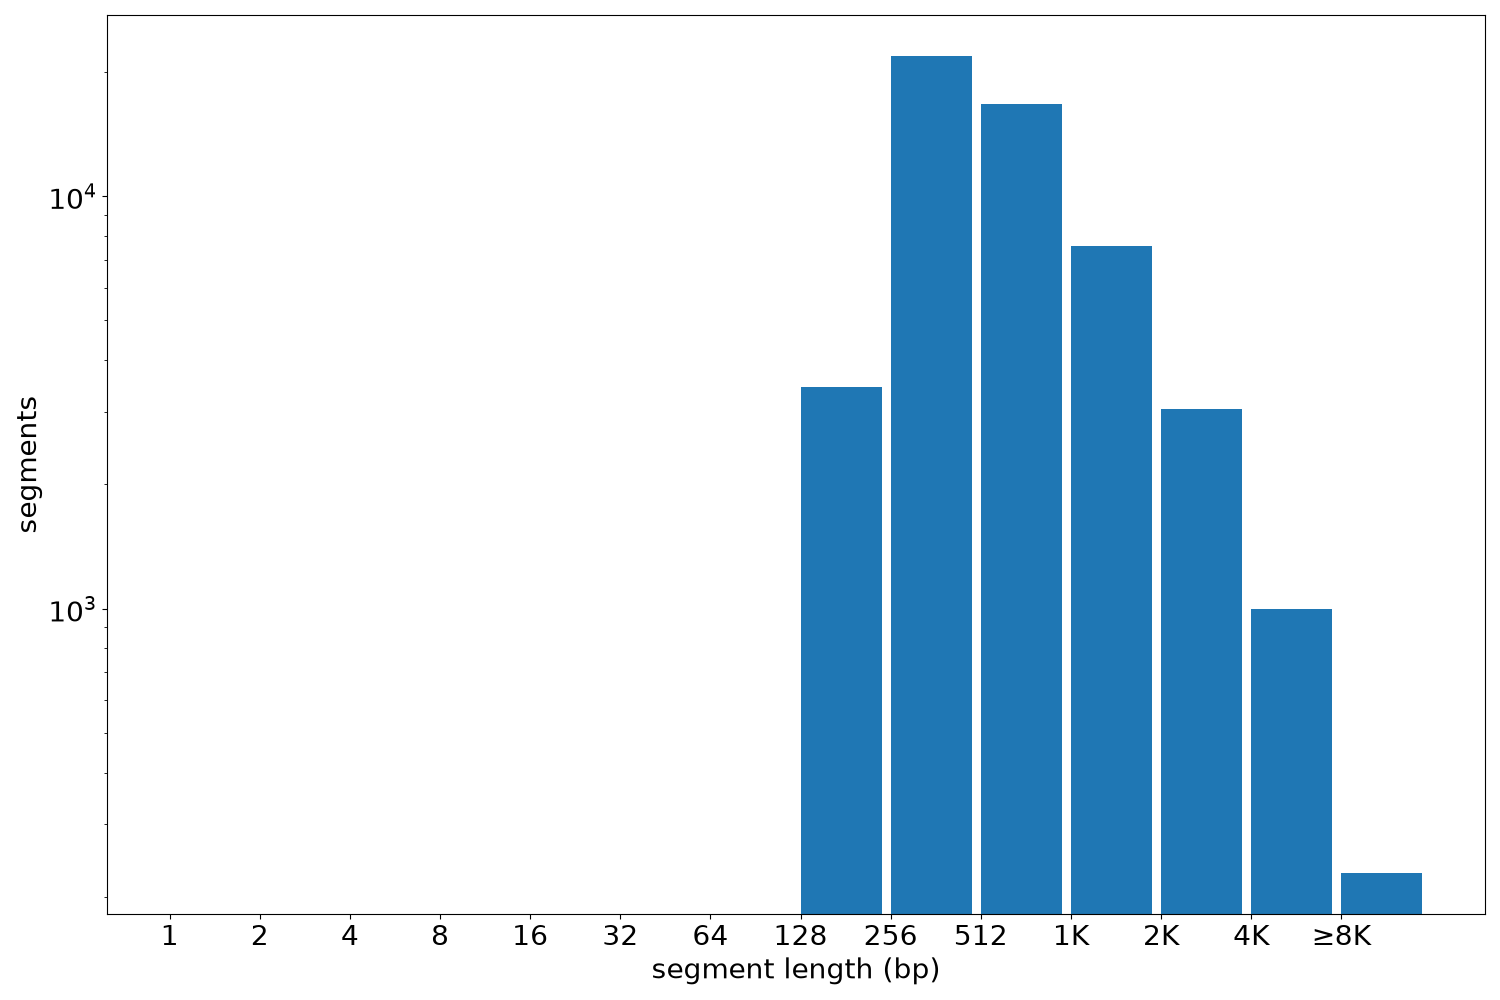
Segment lengths
| segments | min | max | mean | median | |
|---|---|---|---|---|---|
| segments | 53889 | 218 | 30573 | 893.58 | 540 |
Files
| Filename | Size | md5 |
|---|---|---|
| ENCFF906TXM.bed.gz | 1.14 MB | 052be0eaee59c4de276e154bd75b78d7 |
| ENCFF906TXM.tabix.bed.gz | 563.36 KB | 969456a7435fa0a0e2fb5ab2b439ac11 |
| ENCFF906TXM.tabix.bed.gz.tbi | 143.19 KB | 1ad2b9b7487a217b9f7c4c4dc2d2f65c |
| genomic_resource.yaml | 4.0 KB | ecaf364059ba5c60e264bd72e6bdc148 |
| statistics/ |