Resource
| Id | Histone_ChIP-seq/ENCSR726HTS |
|---|---|
| Type | position_score |
| Version | 0 |
| Summary | Histone_ChIP-seq ENCSR726HTS [biosample_summary="Homo sapiens spleen tissue female adult (53 years)" and target="H3K27ac"] |
| Description |
status: released biological_replicates: Rep 1, Rep 2 summary: female adult (53 years) output_type: pseudoreplicated peaks audit_internal_action: Released analysis {ENCAN971HBR|/analyses/ENCAN971HBR/} has in progress subobject quality standard {encode4-histone-chip|/quality-standards/encode4-histone-chip/} audit_internal_action: Released analysis {ENCAN971HBR|/analyses/ENCAN971HBR/} has in progress subobject document {feec31e3-d248-4aa8-9866-3fb5298ef9e7|/documents/feec31e3-d248-4aa8-9866-3fb5298ef9e7/} audit_warning: PBC1 (PCR Bottlenecking Coefficient 1, M1/M_distinct) is the ratio of the number of genomic locations where exactly one read maps uniquely (M1) to the number of genomic locations where some reads map (M_distinct). A PBC1 value in the range 0 - 0.5 is severe bottlenecking, 0.5 - 0.8 is moderate bottlenecking, 0.8 - 0.9 is mild bottlenecking, and > 0.9 is no bottlenecking. PBC1 value > 0.9 is recommended, but > 0.8 is acceptable. ENCODE processed alignments file {ENCFF123UXQ|/files/ENCFF123UXQ/} processed by ChIP-seq ENCODE4 v1.5.1 GRCh38 pipeline was generated from a library with PBC1 value of 0.88. audit_warning: PBC2 (PCR Bottlenecking Coefficient 2, M1/M2) is the ratio of the number of genomic locations where exactly one read maps uniquely (M1) to the number of genomic locations where two reads map uniquely (M2). A PBC2 value in the range 0 - 1 is severe bottlenecking, 1 - 3 is moderate bottlenecking, 3 - 10 is mild bottlenecking, > 10 is no bottlenecking. PBC2 value > 10 is recommended, but > 3 is acceptable. ENCODE processed alignments file {ENCFF123UXQ|/files/ENCFF123UXQ/} processed by ChIP-seq ENCODE4 v1.5.1 GRCh38 pipeline was generated from a library with PBC2 value of 9.41. |
| Labels |
|
Scores (1)
| ID | Type | Default annotation | Description | Histogram | Range | Summary |
|---|---|---|---|---|---|---|
| Histone_ChIP-seq_ENCSR726HTS | float |
Histone_ChIP-seq_ENCSR726HTS |
Histone_ChIP-seq ENCSR726HTS [biosample_summary="Homo sapiens spleen tissue female adult (53 years)" and target="H3K27ac"]
|
 |
[1.65, 90.1] |
|
n counts base pairs; sd is the population standard deviation.
Coverage
| Chromosome | Covered positions | Covered % | Segments |
|---|---|---|---|
| all chromosomes | 163298192 | 5.08% | 92875 |
| chr1 | 16191043 | 6.50% | 9062 |
| chr2 | 12670263 | 5.23% | 7345 |
| chr3 | 10303190 | 5.20% | 6326 |
| chr4 | 5951622 | 3.13% | 3747 |
| chr5 | 7741356 | 4.26% | 4579 |
| chr6 | 8877987 | 5.20% | 5202 |
| chr7 | 7509981 | 4.71% | 4599 |
| chr8 | 6407528 | 4.41% | 3805 |
| chr9 | 7078386 | 5.11% | 4007 |
| chr10 | 7888003 | 5.90% | 4512 |
| chr11 | 8749407 | 6.48% | 4591 |
| chr12 | 8443196 | 6.34% | 4777 |
| chr13 | 3330431 | 2.91% | 2099 |
| chr14 | 6145214 | 5.74% | 3288 |
| chr15 | 5552358 | 5.44% | 3087 |
| chr16 | 6087721 | 6.74% | 3321 |
| chr17 | 9174415 | 11.02% | 4770 |
| chr18 | 2777703 | 3.46% | 1761 |
| chr19 | 7840189 | 13.38% | 3898 |
| chr20 | 4869996 | 7.56% | 2634 |
| chr21 | 2063411 | 4.42% | 1226 |
| chr22 | 4263072 | 8.39% | 2211 |
| chrX | 3381720 | 2.17% | 2028 |
| 3343 contigs with no values (186304500 bp) | 0 | 0.00% | 0 |
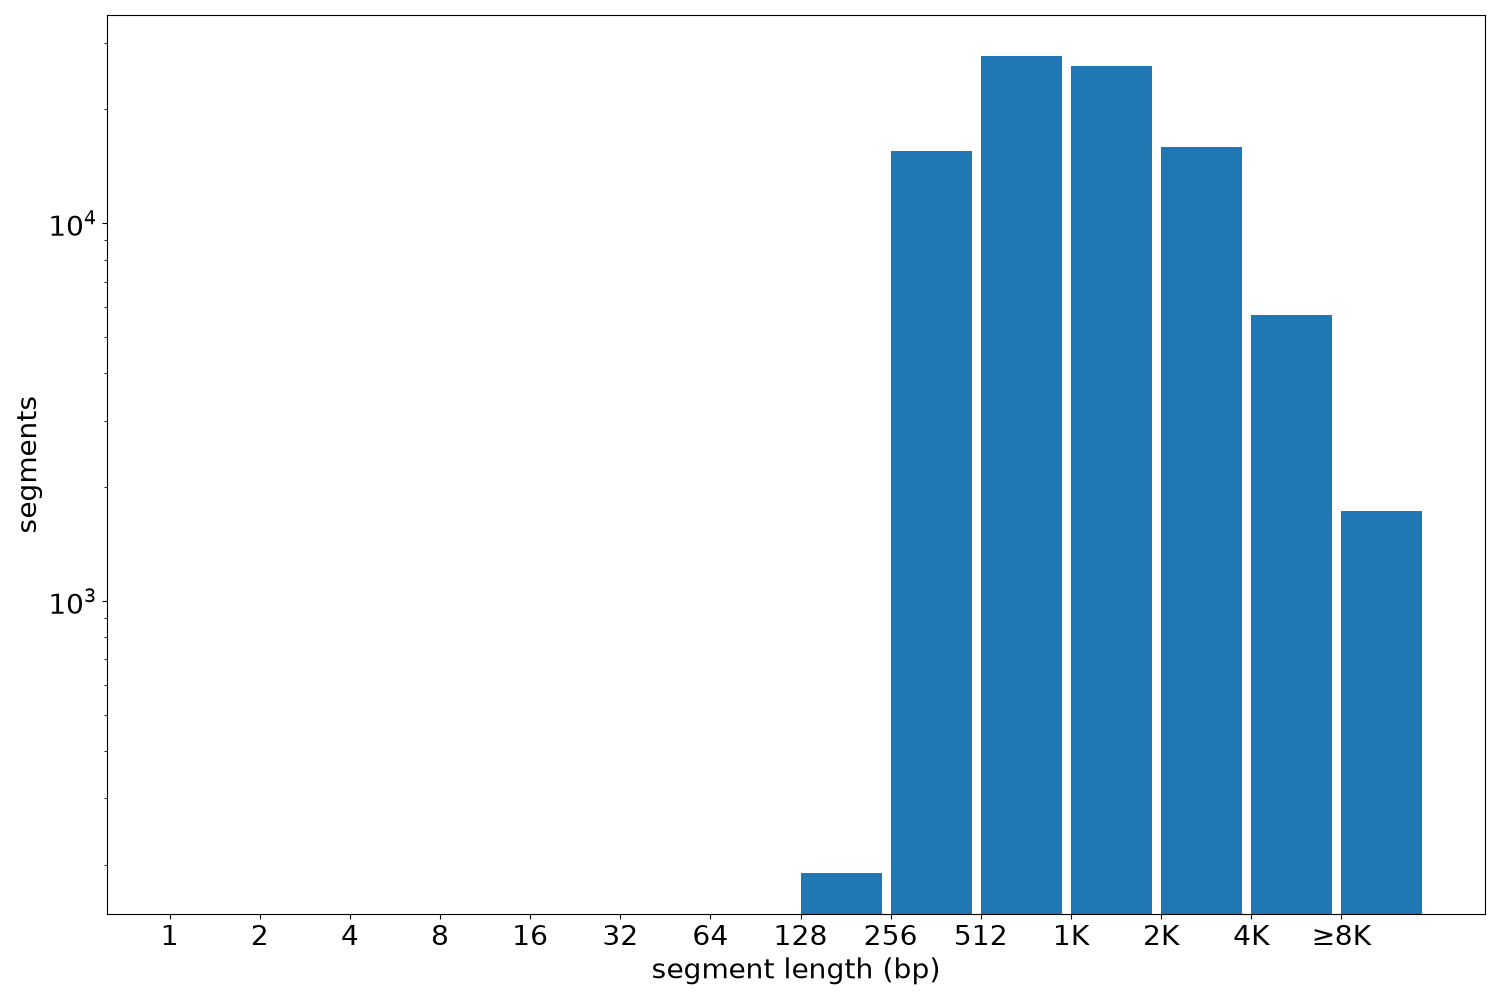
Segment lengths
| segments | min | max | mean | median | |
|---|---|---|---|---|---|
| segments | 92875 | 216 | 77507 | 1758.26 | 1102 |
Files
| Filename | Size | md5 |
|---|---|---|
| ENCFF559GDW.bed.gz | 2.31 MB | a9402ad92459f2fca999c6ddca0cbf7b |
| ENCFF559GDW.tabix.bed.gz | 1023.0 KB | b5c73e771a77138eea068cc07c5d22a0 |
| ENCFF559GDW.tabix.bed.gz.tbi | 250.37 KB | aeb32e330efaad47c3dfa50eb26c5405 |
| genomic_resource.yaml | 2.98 KB | 185a4c75d112b72524a8f1ede910e3eb |
| statistics/ |