Resource
| Id | Histone_ChIP-seq/ENCSR694RCH |
|---|---|
| Type | position_score |
| Version | 0 |
| Summary | Histone_ChIP-seq ENCSR694RCH [biosample_summary="Homo sapiens muscle layer of duodenum tissue male adult (59 years)" and target="H3K27ac"] |
| Description |
status: released biological_replicates: Rep 1 summary: male adult (59 years) output_type: pseudoreplicated peaks audit_internal_action: Archived analysis {ENCAN729RLO|/analyses/ENCAN729RLO/} has in progress subobject quality standard {encode3-histone-chip|/quality-standards/encode3-histone-chip/} audit_warning: PBC1 (PCR Bottlenecking Coefficient 1, M1/M_distinct) is the ratio of the number of genomic locations where exactly one read maps uniquely (M1) to the number of genomic locations where some reads map (M_distinct). A PBC1 value in the range 0 - 0.5 is severe bottlenecking, 0.5 - 0.8 is moderate bottlenecking, 0.8 - 0.9 is mild bottlenecking, and > 0.9 is no bottlenecking. PBC1 value > 0.9 is recommended, but > 0.8 is acceptable. ENCODE processed redacted alignments file {ENCFF630DOD|/files/ENCFF630DOD/} processed by ChIP-seq ENCODE3 hg19 pipeline was generated from a library with PBC1 value of 0.90. audit_warning: PBC2 (PCR Bottlenecking Coefficient 2, M1/M2) is the ratio of the number of genomic locations where exactly one read maps uniquely (M1) to the number of genomic locations where two reads map uniquely (M2). A PBC2 value in the range 0 - 1 is severe bottlenecking, 1 - 3 is moderate bottlenecking, 3 - 10 is mild bottlenecking, > 10 is no bottlenecking. PBC2 value > 10 is recommended, but > 3 is acceptable. ENCODE processed redacted alignments file {ENCFF630DOD|/files/ENCFF630DOD/} processed by ChIP-seq ENCODE3 hg19 pipeline was generated from a library with PBC2 value of 9.95. |
| Labels |
|
Scores (1)
| ID | Type | Default annotation | Description | Histogram | Range | Summary |
|---|---|---|---|---|---|---|
| Histone_ChIP-seq_ENCSR694RCH | float |
Histone_ChIP-seq_ENCSR694RCH |
Histone_ChIP-seq ENCSR694RCH [biosample_summary="Homo sapiens muscle layer of duodenum tissue male adult (59 years)" and target="H3K27ac"]
|
 |
[1.94, 66.5] |
|
n counts base pairs; sd is the population standard deviation.
Coverage
| Chromosome | Covered positions | Covered % | Segments |
|---|---|---|---|
| all chromosomes | 60049639 | 1.87% | 54379 |
| chr1 | 6460454 | 2.60% | 5661 |
| chr2 | 4687848 | 1.94% | 4198 |
| chr3 | 3930377 | 1.98% | 3490 |
| chr4 | 2562071 | 1.35% | 2339 |
| chr5 | 3012633 | 1.66% | 2688 |
| chr6 | 3454383 | 2.02% | 3130 |
| chr7 | 2539532 | 1.59% | 2351 |
| chr8 | 2187040 | 1.51% | 2085 |
| chr9 | 2765230 | 2.00% | 2513 |
| chr10 | 3094685 | 2.31% | 2782 |
| chr11 | 3322332 | 2.46% | 2852 |
| chr12 | 3388683 | 2.54% | 2912 |
| chr13 | 1353325 | 1.18% | 1234 |
| chr14 | 2222767 | 2.08% | 1981 |
| chr15 | 2106594 | 2.07% | 1887 |
| chr16 | 1754358 | 1.94% | 1757 |
| chr17 | 3166359 | 3.80% | 2835 |
| chr18 | 1062717 | 1.32% | 1023 |
| chr19 | 2211228 | 3.77% | 2112 |
| chr20 | 1562063 | 2.42% | 1486 |
| chr21 | 694347 | 1.49% | 684 |
| chr22 | 1239802 | 2.44% | 1135 |
| chrX | 1239053 | 0.79% | 1215 |
| chrY | 31758 | 0.06% | 29 |
| 3342 contigs with no values (129077085 bp) | 0 | 0.00% | 0 |
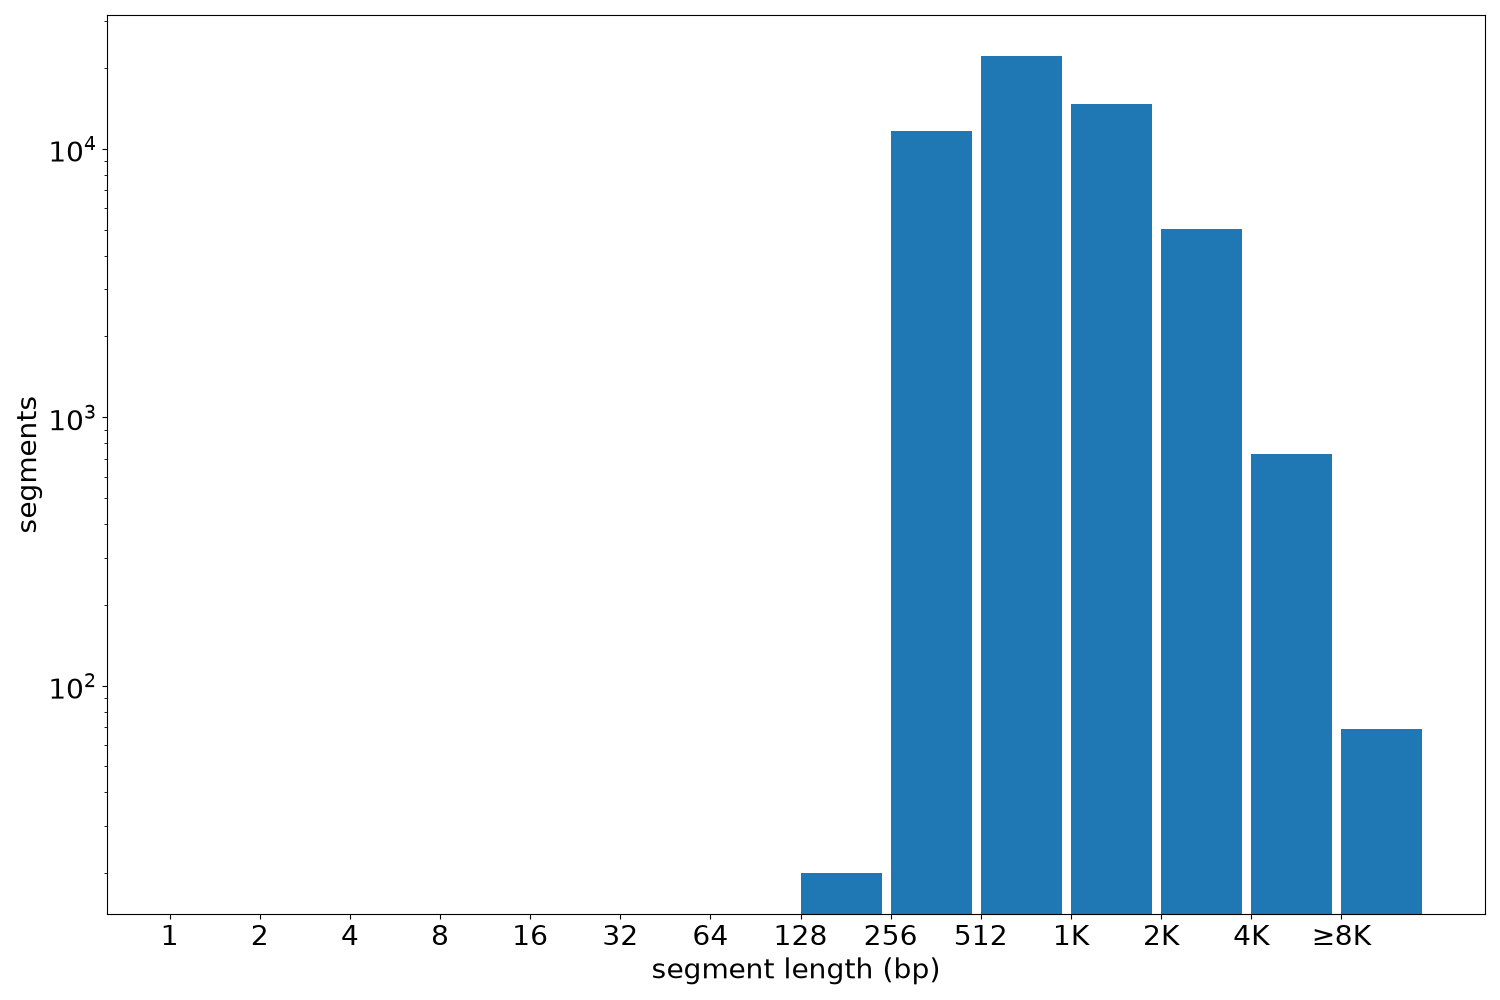
Segment lengths
| segments | min | max | mean | median | |
|---|---|---|---|---|---|
| segments | 54379 | 250 | 16280 | 1104.28 | 820 |
Files
| Filename | Size | md5 |
|---|---|---|
| ENCFF693RYI.bed.gz | 1.19 MB | a9009c74d11bab86ba99913fc10c49b4 |
| ENCFF693RYI.tabix.bed.gz | 573.17 KB | 6681c25427867886fdd145b4835f7519 |
| ENCFF693RYI.tabix.bed.gz.tbi | 200.23 KB | 9e9017fb301a171556717e2bd7ddfde8 |
| genomic_resource.yaml | 2.81 KB | b6067d3d5c75fd3c445b5eb36b0ce195 |
| statistics/ |