Resource
| Id | Histone_ChIP-seq/ENCSR560IDY |
|---|---|
| Type | position_score |
| Version | 0 |
| Summary | Histone_ChIP-seq ENCSR560IDY [biosample_summary="Homo sapiens skeletal muscle tissue tissue" and target="H3K9ac"] |
| Description |
status: released biological_replicates: Rep 1 summary: output_type: pseudoreplicated peaks audit_internal_action: Archived analysis {ENCAN803QRY|/analyses/ENCAN803QRY/} has in progress subobject quality standard {encode3-histone-chip|/quality-standards/encode3-histone-chip/} audit_warning: PBC1 (PCR Bottlenecking Coefficient 1, M1/M_distinct) is the ratio of the number of genomic locations where exactly one read maps uniquely (M1) to the number of genomic locations where some reads map (M_distinct). A PBC1 value in the range 0 - 0.5 is severe bottlenecking, 0.5 - 0.8 is moderate bottlenecking, 0.8 - 0.9 is mild bottlenecking, and > 0.9 is no bottlenecking. PBC1 value > 0.9 is recommended, but > 0.8 is acceptable. ENCODE processed redacted alignments file {ENCFF547ZOC|/files/ENCFF547ZOC/} processed by ChIP-seq ENCODE3 hg19 pipeline was generated from a library with PBC1 value of 0.85. audit_warning: PBC2 (PCR Bottlenecking Coefficient 2, M1/M2) is the ratio of the number of genomic locations where exactly one read maps uniquely (M1) to the number of genomic locations where two reads map uniquely (M2). A PBC2 value in the range 0 - 1 is severe bottlenecking, 1 - 3 is moderate bottlenecking, 3 - 10 is mild bottlenecking, > 10 is no bottlenecking. PBC2 value > 10 is recommended, but > 3 is acceptable. ENCODE processed redacted alignments file {ENCFF547ZOC|/files/ENCFF547ZOC/} processed by ChIP-seq ENCODE3 hg19 pipeline was generated from a library with PBC2 value of 6.49. |
| Labels |
|
Scores (1)
| ID | Type | Default annotation | Description | Histogram | Range | Summary |
|---|---|---|---|---|---|---|
| Histone_ChIP-seq_ENCSR560IDY | float |
Histone_ChIP-seq_ENCSR560IDY |
Histone_ChIP-seq ENCSR560IDY [biosample_summary="Homo sapiens skeletal muscle tissue tissue" and target="H3K9ac"]
|
 |
[1.85, 55.8] |
|
n counts base pairs; sd is the population standard deviation.
Coverage
| Chromosome | Covered positions | Covered % | Segments |
|---|---|---|---|
| all chromosomes | 38365184 | 1.19% | 60573 |
| chr1 | 4037651 | 1.62% | 6321 |
| chr2 | 2815625 | 1.16% | 4470 |
| chr3 | 2473765 | 1.25% | 3903 |
| chr4 | 1473176 | 0.77% | 2278 |
| chr5 | 1847476 | 1.02% | 2863 |
| chr6 | 2163946 | 1.27% | 3347 |
| chr7 | 1671001 | 1.05% | 2733 |
| chr8 | 1466321 | 1.01% | 2374 |
| chr9 | 1618757 | 1.17% | 2602 |
| chr10 | 1818331 | 1.36% | 2980 |
| chr11 | 2075006 | 1.54% | 3252 |
| chr12 | 2022526 | 1.52% | 3093 |
| chr13 | 717477 | 0.63% | 1145 |
| chr14 | 1267907 | 1.18% | 2015 |
| chr15 | 1257423 | 1.23% | 2042 |
| chr16 | 1477773 | 1.64% | 2361 |
| chr17 | 2329552 | 2.80% | 3697 |
| chr18 | 639644 | 0.80% | 1032 |
| chr19 | 2055974 | 3.51% | 3081 |
| chr20 | 1014386 | 1.57% | 1638 |
| chr21 | 387273 | 0.83% | 622 |
| chr22 | 976641 | 1.92% | 1579 |
| chrX | 733349 | 0.47% | 1116 |
| chrY | 24204 | 0.04% | 29 |
| 3342 contigs with no values (129077085 bp) | 0 | 0.00% | 0 |
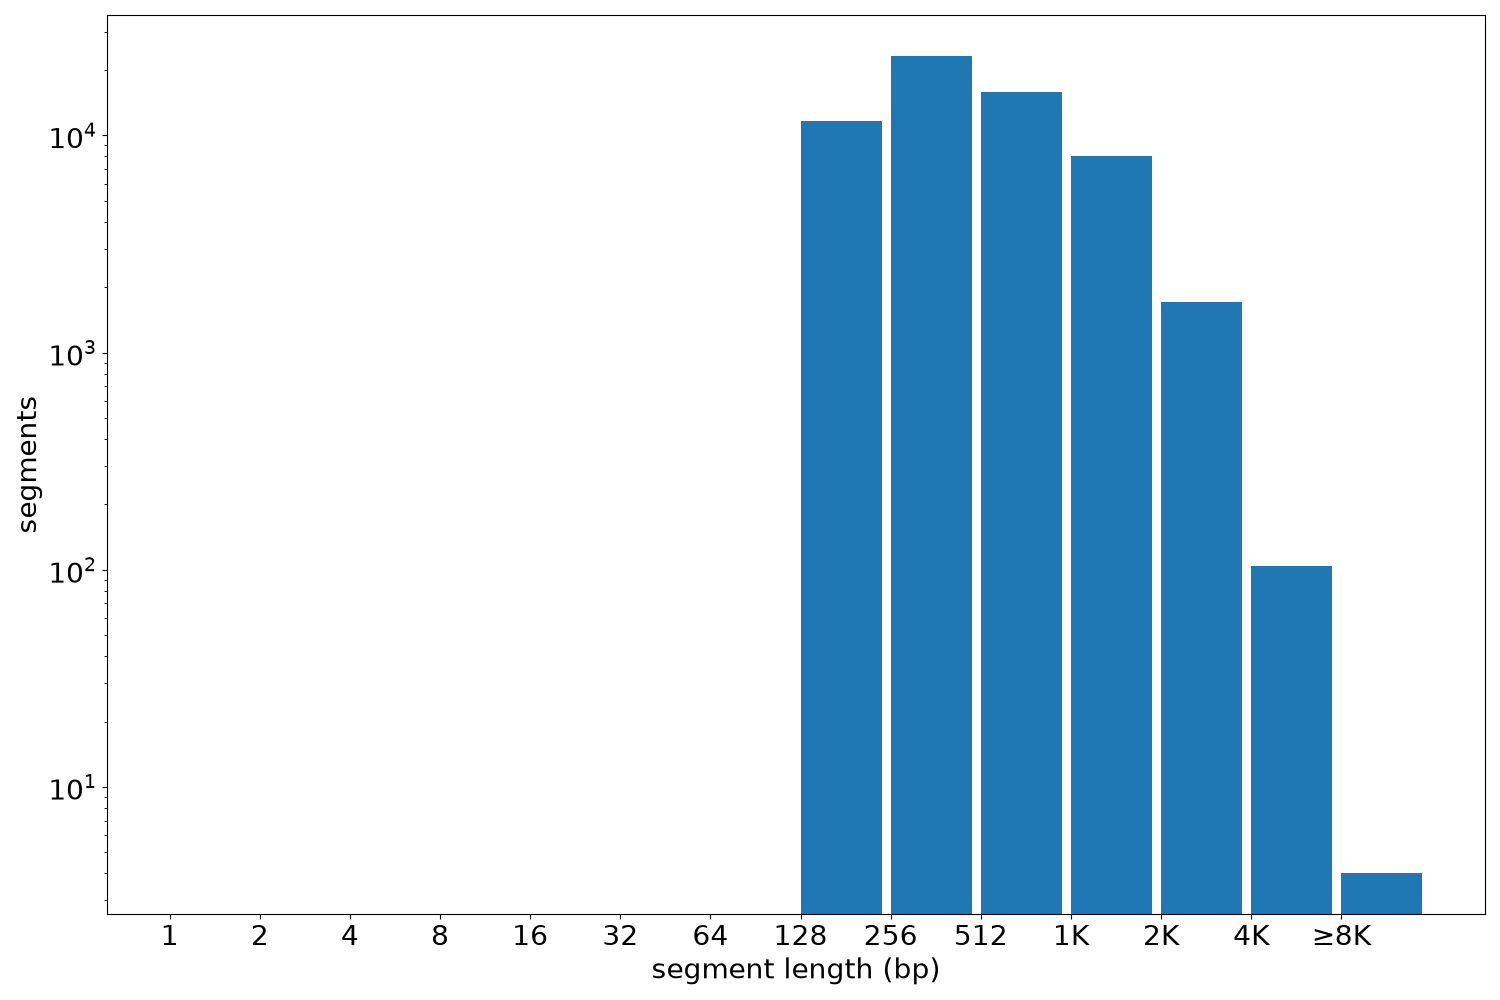
Segment lengths
| segments | min | max | mean | median | |
|---|---|---|---|---|---|
| segments | 60573 | 145 | 9635 | 633.37 | 440 |
Files
| Filename | Size | md5 |
|---|---|---|
| ENCFF606ACB.bed.gz | 1.23 MB | fb1845ba45e58c663cfd36e5a19ecf17 |
| ENCFF606ACB.tabix.bed.gz | 608.86 KB | a63171d8731b84261a97ef2238792476 |
| ENCFF606ACB.tabix.bed.gz.tbi | 213.61 KB | 3b9a08490c726198e883ffcc125c9a12 |
| genomic_resource.yaml | 2.75 KB | 446338989e65a0736fa84b2a020b50bc |
| statistics/ |