Resource
| Id | Histone_ChIP-seq/ENCSR535GFO |
|---|---|
| Type | position_score |
| Version | 0 |
| Summary | Histone_ChIP-seq ENCSR535GFO [biosample_summary="Homo sapiens tibial artery tissue male adult (54 years)" and target="H3K27ac"] |
| Description |
status: released biological_replicates: Rep 1, Rep 2 summary: male adult (54 years) output_type: pseudoreplicated peaks audit_internal_action: Released analysis {ENCAN320YUD|/analyses/ENCAN320YUD/} has in progress subobject quality standard {encode4-histone-chip|/quality-standards/encode4-histone-chip/} audit_internal_action: Released analysis {ENCAN320YUD|/analyses/ENCAN320YUD/} has in progress subobject document {a032d1aa-f626-42e4-8a48-fcfdaa87b9cc|/documents/a032d1aa-f626-42e4-8a48-fcfdaa87b9cc/} audit_warning: PBC1 (PCR Bottlenecking Coefficient 1, M1/M_distinct) is the ratio of the number of genomic locations where exactly one read maps uniquely (M1) to the number of genomic locations where some reads map (M_distinct). A PBC1 value in the range 0 - 0.5 is severe bottlenecking, 0.5 - 0.8 is moderate bottlenecking, 0.8 - 0.9 is mild bottlenecking, and > 0.9 is no bottlenecking. PBC1 value > 0.9 is recommended, but > 0.8 is acceptable. ENCODE processed alignments file {ENCFF302XVI|/files/ENCFF302XVI/} processed by ChIP-seq ENCODE4 v1.5.1 GRCh38 pipeline was generated from a library with PBC1 value of 0.89. audit_warning: PBC2 (PCR Bottlenecking Coefficient 2, M1/M2) is the ratio of the number of genomic locations where exactly one read maps uniquely (M1) to the number of genomic locations where two reads map uniquely (M2). A PBC2 value in the range 0 - 1 is severe bottlenecking, 1 - 3 is moderate bottlenecking, 3 - 10 is mild bottlenecking, > 10 is no bottlenecking. PBC2 value > 10 is recommended, but > 3 is acceptable. ENCODE processed alignments file {ENCFF302XVI|/files/ENCFF302XVI/} processed by ChIP-seq ENCODE4 v1.5.1 GRCh38 pipeline was generated from a library with PBC2 value of 9.29. |
| Labels |
|
Scores (1)
| ID | Type | Default annotation | Description | Histogram | Range | Summary |
|---|---|---|---|---|---|---|
| Histone_ChIP-seq_ENCSR535GFO | float |
Histone_ChIP-seq_ENCSR535GFO |
Histone_ChIP-seq ENCSR535GFO [biosample_summary="Homo sapiens tibial artery tissue male adult (54 years)" and target="H3K27ac"]
|
 |
[1.54, 44.8] |
|
n counts base pairs; sd is the population standard deviation.
Coverage
| Chromosome | Covered positions | Covered % | Segments |
|---|---|---|---|
| all chromosomes | 141792543 | 4.41% | 62479 |
| chr1 | 13964940 | 5.61% | 5858 |
| chr2 | 11450736 | 4.73% | 5156 |
| chr3 | 10309639 | 5.20% | 4419 |
| chr4 | 6340937 | 3.33% | 2891 |
| chr5 | 7657317 | 4.22% | 3506 |
| chr6 | 7902837 | 4.63% | 3657 |
| chr7 | 6359805 | 3.99% | 2959 |
| chr8 | 6054800 | 4.17% | 2807 |
| chr9 | 6408107 | 4.63% | 2720 |
| chr10 | 8064081 | 6.03% | 3520 |
| chr11 | 7490270 | 5.54% | 3121 |
| chr12 | 7635226 | 5.73% | 3254 |
| chr13 | 3180173 | 2.78% | 1476 |
| chr14 | 4513966 | 4.22% | 1970 |
| chr15 | 5130750 | 5.03% | 2241 |
| chr16 | 4466247 | 4.94% | 2042 |
| chr17 | 6272123 | 7.53% | 2606 |
| chr18 | 2567747 | 3.19% | 1209 |
| chr19 | 4683186 | 7.99% | 2020 |
| chr20 | 3635630 | 5.64% | 1514 |
| chr21 | 1691494 | 3.62% | 760 |
| chr22 | 2800873 | 5.51% | 1149 |
| chrX | 3133021 | 2.01% | 1576 |
| chrY | 78638 | 0.14% | 48 |
| 3342 contigs with no values (129077085 bp) | 0 | 0.00% | 0 |
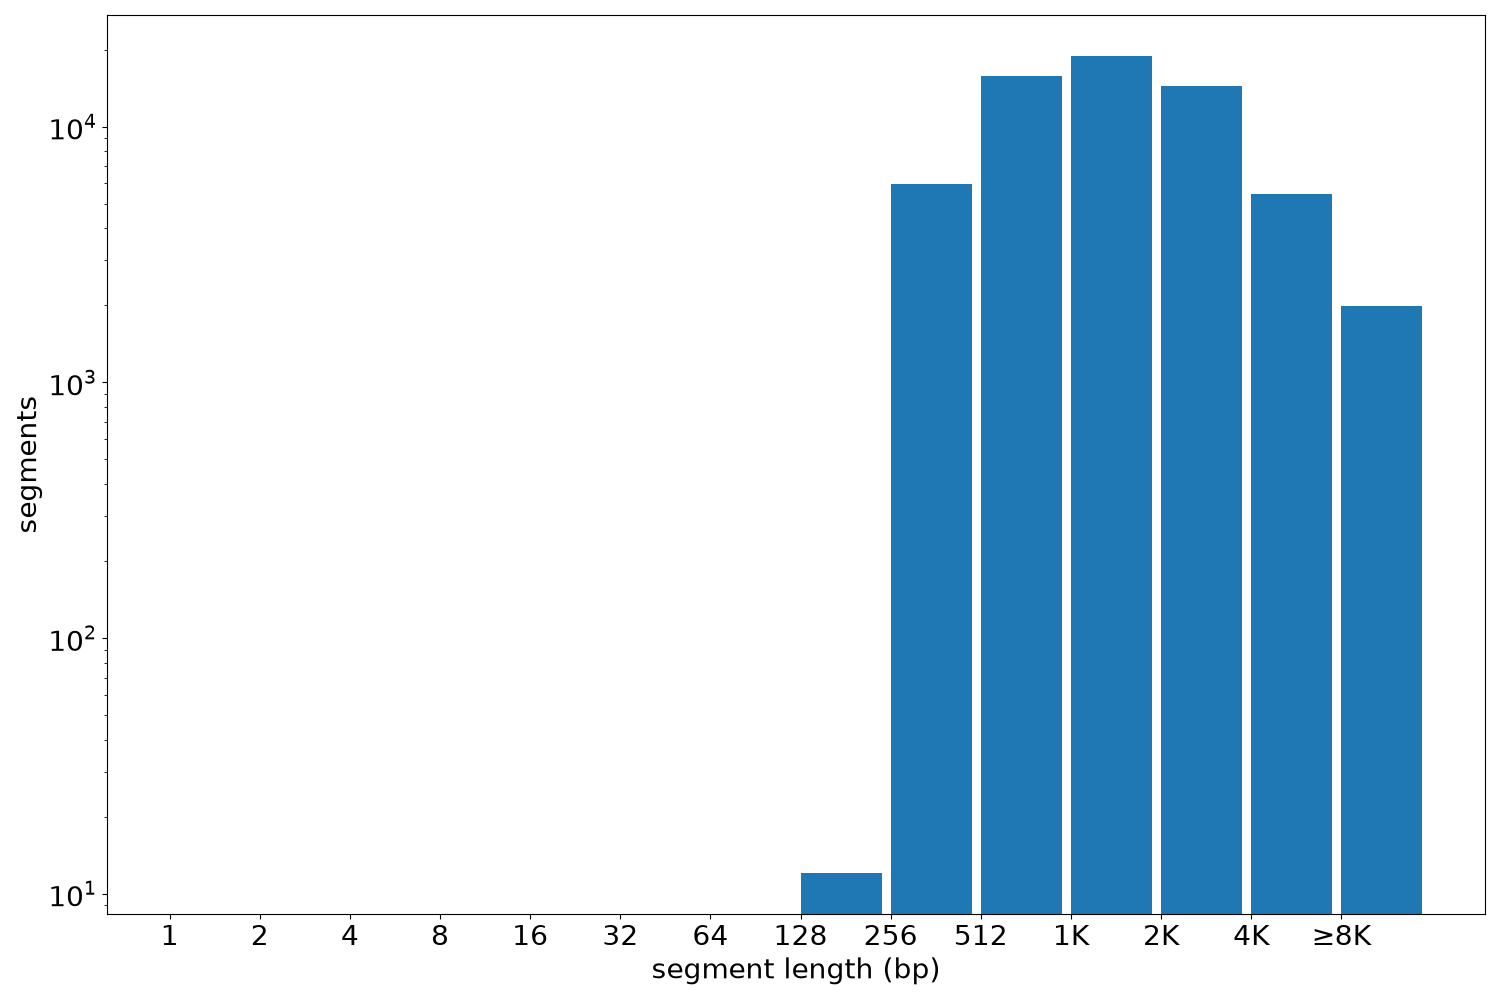
Segment lengths
| segments | min | max | mean | median | |
|---|---|---|---|---|---|
| segments | 62479 | 238 | 117815 | 2269.44 | 1463 |
Files
| Filename | Size | md5 |
|---|---|---|
| ENCFF523WDP.bed.gz | 1.68 MB | 91c6a3136abb9bcf9371e3514107cd5b |
| ENCFF523WDP.tabix.bed.gz | 716.89 KB | d4ad80b0afcc70dc770bfa8af8092e92 |
| ENCFF523WDP.tabix.bed.gz.tbi | 216.55 KB | 4393e7205f7cf144d2f870306c5461c8 |
| genomic_resource.yaml | 2.99 KB | 44bc523804b9af2c185b501905fd9673 |
| statistics/ |