Resource
| Id | Histone_ChIP-seq/ENCSR521AIV |
|---|---|
| Type | position_score |
| Version | 0 |
| Summary | Histone_ChIP-seq ENCSR521AIV [biosample_summary="Homo sapiens KMS-11" and target="H3K9ac"] |
| Description |
status: released biological_replicates: Rep 1, Rep 2 summary: output_type: replicated peaks audit_internal_action: Archived analysis {ENCAN614SXG|/analyses/ENCAN614SXG/} has in progress subobject quality standard {encode3-histone-chip|/quality-standards/encode3-histone-chip/} audit_warning: PBC1 (PCR Bottlenecking Coefficient 1, M1/M_distinct) is the ratio of the number of genomic locations where exactly one read maps uniquely (M1) to the number of genomic locations where some reads map (M_distinct). A PBC1 value in the range 0 - 0.5 is severe bottlenecking, 0.5 - 0.8 is moderate bottlenecking, 0.8 - 0.9 is mild bottlenecking, and > 0.9 is no bottlenecking. PBC1 value > 0.9 is recommended, but > 0.8 is acceptable. ENCODE processed alignments file {ENCFF500IQP|/files/ENCFF500IQP/} processed by ChIP-seq ENCODE3 GRCh38 pipeline was generated from a library with PBC1 value of 0.86. audit_warning: PBC2 (PCR Bottlenecking Coefficient 2, M1/M2) is the ratio of the number of genomic locations where exactly one read maps uniquely (M1) to the number of genomic locations where two reads map uniquely (M2). A PBC2 value in the range 0 - 1 is severe bottlenecking, 1 - 3 is moderate bottlenecking, 3 - 10 is mild bottlenecking, > 10 is no bottlenecking. PBC2 value > 10 is recommended, but > 3 is acceptable. ENCODE processed alignments file {ENCFF500IQP|/files/ENCFF500IQP/} processed by ChIP-seq ENCODE3 GRCh38 pipeline was generated from a library with PBC2 value of 7.16. |
| Labels |
|
Scores (1)
| ID | Type | Default annotation | Description | Histogram | Range | Summary |
|---|---|---|---|---|---|---|
| Histone_ChIP-seq_ENCSR521AIV | float |
Histone_ChIP-seq_ENCSR521AIV |
Histone_ChIP-seq ENCSR521AIV [biosample_summary="Homo sapiens KMS-11" and target="H3K9ac"]
|
 |
[1.3, 67.9] |
|
n counts base pairs; sd is the population standard deviation.
Coverage
| Chromosome | Covered positions | Covered % | Segments |
|---|---|---|---|
| all chromosomes | 37418790 | 1.16% | 27366 |
| chr1 | 3679913 | 1.48% | 2657 |
| chr1_KI270713v1_random | 385 | 0.94% | 1 |
| chr2 | 2870089 | 1.19% | 2007 |
| chr3 | 2192799 | 1.11% | 1584 |
| chr4 | 1710778 | 0.90% | 1246 |
| chr5 | 2044917 | 1.13% | 1399 |
| chr6 | 2350977 | 1.38% | 1616 |
| chr7 | 2061480 | 1.29% | 1488 |
| chr8 | 1689153 | 1.16% | 1209 |
| chr9 | 1513315 | 1.09% | 1155 |
| chr10 | 1684975 | 1.26% | 1149 |
| chr11 | 1759927 | 1.30% | 1311 |
| chr12 | 1959617 | 1.47% | 1428 |
| chr13 | 686284 | 0.60% | 553 |
| chr14 | 1098559 | 1.03% | 902 |
| chr15 | 1214030 | 1.19% | 869 |
| chr16 | 1349499 | 1.49% | 1015 |
| chr17 | 1956458 | 2.35% | 1424 |
| chr17_GL000205v2_random | 3169 | 1.71% | 5 |
| chr18 | 848571 | 1.06% | 602 |
| chr19 | 1427460 | 2.44% | 1206 |
| chr20 | 999135 | 1.55% | 734 |
| chr21 | 380373 | 0.81% | 294 |
| chr22 | 762377 | 1.50% | 582 |
| chrM | 2540 | 15.33% | 5 |
| chrUn_GL000218v1 | 390 | 0.24% | 1 |
| chrUn_GL000219v1 | 2122 | 1.18% | 2 |
| chrUn_KI270337v1 | 489 | 43.62% | 1 |
| chrUn_KI270438v1 | 1254 | 1.11% | 3 |
| chrUn_KI270466v1 | 895 | 72.59% | 2 |
| chrUn_KI270467v1 | 1559 | 39.77% | 1 |
| chrX | 1165301 | 0.75% | 915 |
| 3334 contigs with no values (185602471 bp) | 0 | 0.00% | 0 |
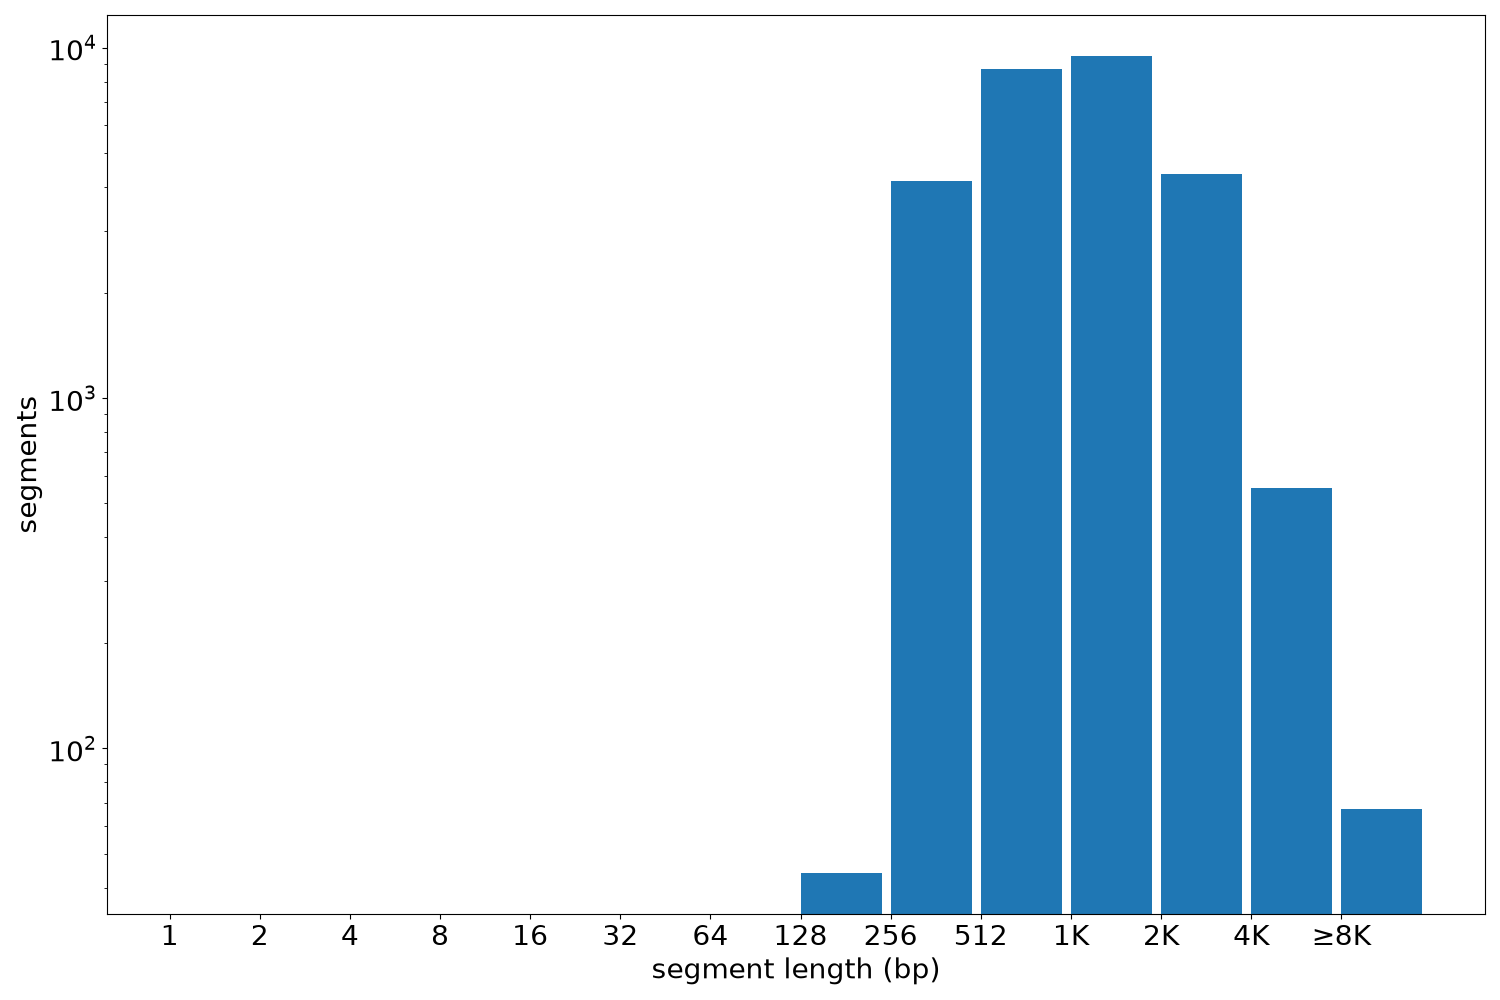
Segment lengths
| segments | min | max | mean | median | |
|---|---|---|---|---|---|
| segments | 27366 | 230 | 24159 | 1367.35 | 1075 |
Files
| Filename | Size | md5 |
|---|---|---|
| ENCFF892LMZ.bed.gz | 727.42 KB | 2cd8aed2c5f1f81d90d4457f2384fdf4 |
| ENCFF892LMZ.tabix.bed.gz | 313.96 KB | 73ecb2f08c5387259865653e7cb8f2be |
| ENCFF892LMZ.tabix.bed.gz.tbi | 160.13 KB | 1093c17837349d82997d881d14ff1b09 |
| genomic_resource.yaml | 2.67 KB | f9c8ec8587bb5d5dacb0758a7aa4e2fc |
| statistics/ |