Resource
| Id | Histone_ChIP-seq/ENCSR505OPZ |
|---|---|
| Type | position_score |
| Version | 0 |
| Summary | Histone_ChIP-seq ENCSR505OPZ [biosample_summary="Homo sapiens iPS DF 19.11" and target="H3K27ac"] |
| Description |
status: released biological_replicates: Rep 1, Rep 2 summary: output_type: replicated peaks audit_internal_action: Archived analysis {ENCAN146WKQ|/analyses/ENCAN146WKQ/} has in progress subobject quality standard {encode3-histone-chip|/quality-standards/encode3-histone-chip/} audit_warning: PBC1 (PCR Bottlenecking Coefficient 1, M1/M_distinct) is the ratio of the number of genomic locations where exactly one read maps uniquely (M1) to the number of genomic locations where some reads map (M_distinct). A PBC1 value in the range 0 - 0.5 is severe bottlenecking, 0.5 - 0.8 is moderate bottlenecking, 0.8 - 0.9 is mild bottlenecking, and > 0.9 is no bottlenecking. PBC1 value > 0.9 is recommended, but > 0.8 is acceptable. ENCODE processed alignments file {ENCFF456DFB|/files/ENCFF456DFB/} processed by ChIP-seq ENCODE3 GRCh38 pipeline was generated from a library with PBC1 value of 0.88. audit_warning: PBC2 (PCR Bottlenecking Coefficient 2, M1/M2) is the ratio of the number of genomic locations where exactly one read maps uniquely (M1) to the number of genomic locations where two reads map uniquely (M2). A PBC2 value in the range 0 - 1 is severe bottlenecking, 1 - 3 is moderate bottlenecking, 3 - 10 is mild bottlenecking, > 10 is no bottlenecking. PBC2 value > 10 is recommended, but > 3 is acceptable. ENCODE processed alignments file {ENCFF456DFB|/files/ENCFF456DFB/} processed by ChIP-seq ENCODE3 GRCh38 pipeline was generated from a library with PBC2 value of 9.12. audit_warning: PBC1 (PCR Bottlenecking Coefficient 1, M1/M_distinct) is the ratio of the number of genomic locations where exactly one read maps uniquely (M1) to the number of genomic locations where some reads map (M_distinct). A PBC1 value in the range 0 - 0.5 is severe bottlenecking, 0.5 - 0.8 is moderate bottlenecking, 0.8 - 0.9 is mild bottlenecking, and > 0.9 is no bottlenecking. PBC1 value > 0.9 is recommended, but > 0.8 is acceptable. ENCODE processed alignments file {ENCFF111NTK|/files/ENCFF111NTK/} processed by ChIP-seq ENCODE3 GRCh38 pipeline was generated from a library with PBC1 value of 0.82. audit_warning: PBC2 (PCR Bottlenecking Coefficient 2, M1/M2) is the ratio of the number of genomic locations where exactly one read maps uniquely (M1) to the number of genomic locations where two reads map uniquely (M2). A PBC2 value in the range 0 - 1 is severe bottlenecking, 1 - 3 is moderate bottlenecking, 3 - 10 is mild bottlenecking, > 10 is no bottlenecking. PBC2 value > 10 is recommended, but > 3 is acceptable. ENCODE processed alignments file {ENCFF111NTK|/files/ENCFF111NTK/} processed by ChIP-seq ENCODE3 GRCh38 pipeline was generated from a library with PBC2 value of 5.47. |
| Labels |
|
Scores (1)
| ID | Type | Default annotation | Description | Histogram | Range | Summary |
|---|---|---|---|---|---|---|
| Histone_ChIP-seq_ENCSR505OPZ | float |
Histone_ChIP-seq_ENCSR505OPZ |
Histone_ChIP-seq ENCSR505OPZ [biosample_summary="Homo sapiens iPS DF 19.11" and target="H3K27ac"]
|
 |
[2.01, 12.4] |
|
n counts base pairs; sd is the population standard deviation.
Coverage
| Chromosome | Covered positions | Covered % | Segments |
|---|---|---|---|
| all chromosomes | 5029742 | 0.16% | 17279 |
| chr1 | 563715 | 0.23% | 1878 |
| chr2 | 368967 | 0.15% | 1239 |
| chr3 | 303803 | 0.15% | 1048 |
| chr4 | 215840 | 0.11% | 748 |
| chr5 | 268992 | 0.15% | 894 |
| chr6 | 358231 | 0.21% | 1179 |
| chr7 | 242284 | 0.15% | 833 |
| chr8 | 171281 | 0.12% | 607 |
| chr9 | 174659 | 0.13% | 621 |
| chr10 | 199730 | 0.15% | 666 |
| chr11 | 251442 | 0.19% | 870 |
| chr12 | 291210 | 0.22% | 990 |
| chr13 | 108319 | 0.09% | 377 |
| chr14 | 168136 | 0.16% | 582 |
| chr15 | 159387 | 0.16% | 531 |
| chr16 | 168559 | 0.19% | 605 |
| chr17 | 255447 | 0.31% | 882 |
| chr18 | 97130 | 0.12% | 325 |
| chr19 | 291234 | 0.50% | 1043 |
| chr20 | 116677 | 0.18% | 411 |
| chr21 | 35616 | 0.08% | 140 |
| chr22 | 87173 | 0.17% | 314 |
| chrX | 127074 | 0.08% | 480 |
| chrY | 4836 | 0.01% | 16 |
| 3342 contigs with no values (129077085 bp) | 0 | 0.00% | 0 |
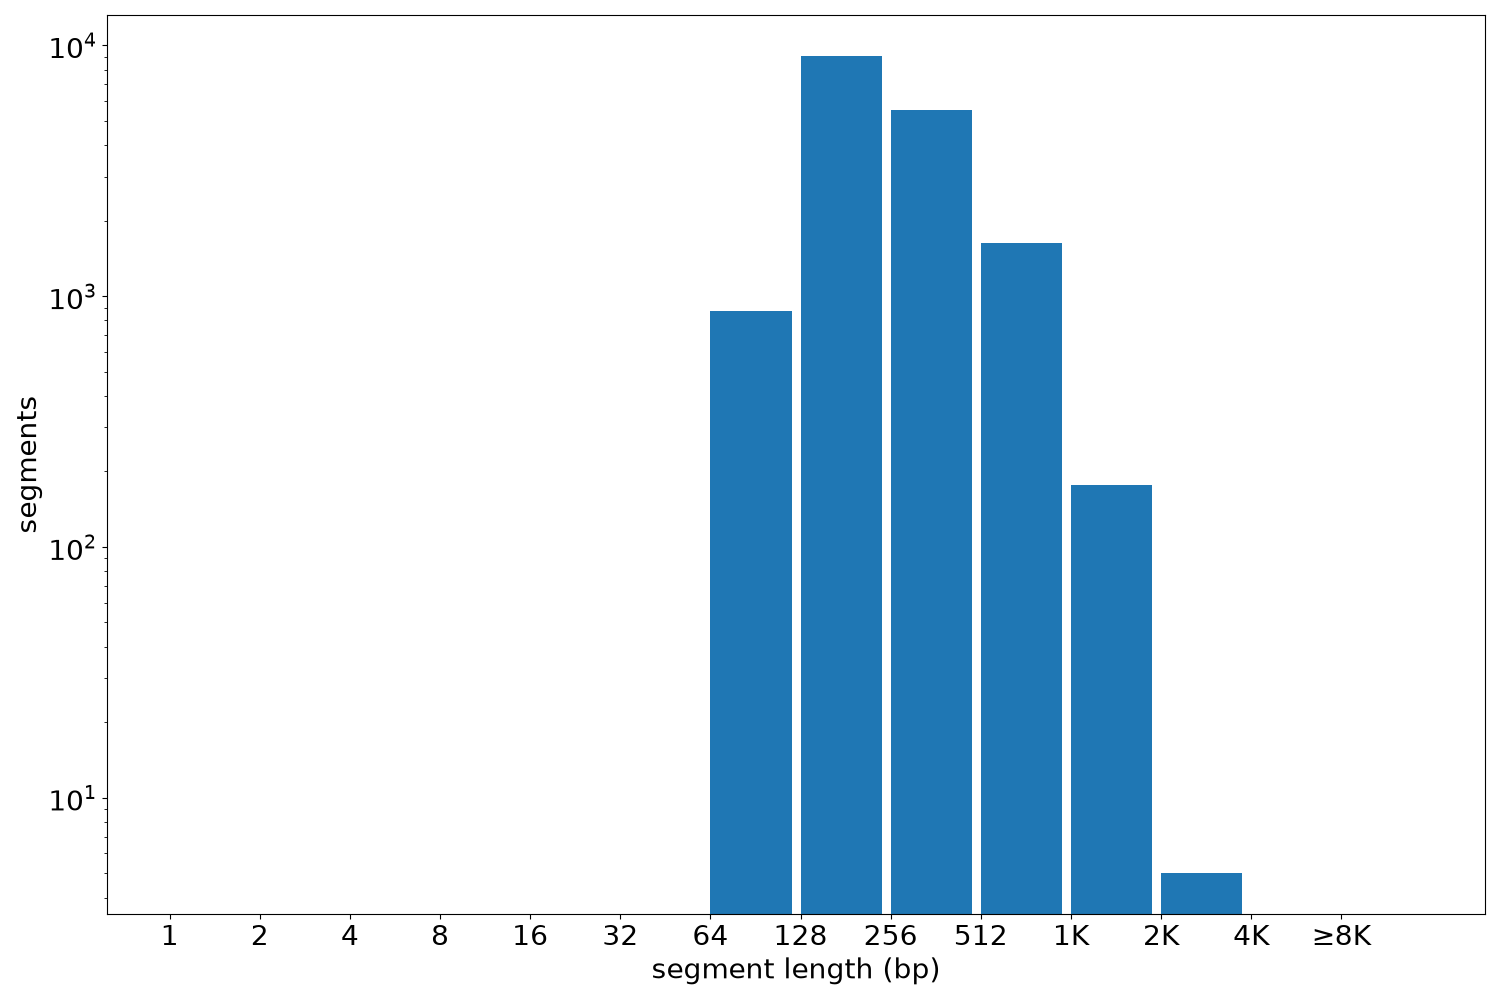
Segment lengths
| segments | min | max | mean | median | |
|---|---|---|---|---|---|
| segments | 17279 | 115 | 3636 | 291.09 | 229 |
Files
| Filename | Size | md5 |
|---|---|---|
| ENCFF749RHX.bed.gz | 347.61 KB | 6de93d1da70f9d169d9897e9eb7ae520 |
| ENCFF749RHX.tabix.bed.gz | 183.08 KB | 09166c39adc4011df423952a6ca3889d |
| ENCFF749RHX.tabix.bed.gz.tbi | 93.34 KB | 4c3918d83f8e26bd0c127fa83344598b |
| genomic_resource.yaml | 3.98 KB | 3f2e1db5d251874c05475ed010dd67ef |
| statistics/ |