Resource
| Id | Histone_ChIP-seq/ENCSR500GXT |
|---|---|
| Type | position_score |
| Version | 0 |
| Summary | Histone_ChIP-seq ENCSR500GXT [biosample_summary="Homo sapiens lung tissue male child (3 years)" and target="H3K4me3"] |
| Description |
status: released biological_replicates: Rep 1 summary: male child (3 years) output_type: pseudoreplicated peaks audit_internal_action: Released analysis {ENCAN318MMV|/analyses/ENCAN318MMV/} has in progress subobject quality standard {encode4-histone-chip|/quality-standards/encode4-histone-chip/} audit_internal_action: Released analysis {ENCAN318MMV|/analyses/ENCAN318MMV/} has in progress subobject document {1735b70e-c77d-4c5d-9fd3-da495a022036|/documents/1735b70e-c77d-4c5d-9fd3-da495a022036/} audit_warning: PBC1 (PCR Bottlenecking Coefficient 1, M1/M_distinct) is the ratio of the number of genomic locations where exactly one read maps uniquely (M1) to the number of genomic locations where some reads map (M_distinct). A PBC1 value in the range 0 - 0.5 is severe bottlenecking, 0.5 - 0.8 is moderate bottlenecking, 0.8 - 0.9 is mild bottlenecking, and > 0.9 is no bottlenecking. PBC1 value > 0.9 is recommended, but > 0.8 is acceptable. ENCODE processed alignments file {ENCFF054JXD|/files/ENCFF054JXD/} processed by ChIP-seq ENCODE4 v1.5.1 GRCh38 pipeline was generated from a library with PBC1 value of 0.86. audit_warning: PBC2 (PCR Bottlenecking Coefficient 2, M1/M2) is the ratio of the number of genomic locations where exactly one read maps uniquely (M1) to the number of genomic locations where two reads map uniquely (M2). A PBC2 value in the range 0 - 1 is severe bottlenecking, 1 - 3 is moderate bottlenecking, 3 - 10 is mild bottlenecking, > 10 is no bottlenecking. PBC2 value > 10 is recommended, but > 3 is acceptable. ENCODE processed alignments file {ENCFF054JXD|/files/ENCFF054JXD/} processed by ChIP-seq ENCODE4 v1.5.1 GRCh38 pipeline was generated from a library with PBC2 value of 7.51. |
| Labels |
|
Scores (1)
| ID | Type | Default annotation | Description | Histogram | Range | Summary |
|---|---|---|---|---|---|---|
| Histone_ChIP-seq_ENCSR500GXT | float |
Histone_ChIP-seq_ENCSR500GXT |
Histone_ChIP-seq ENCSR500GXT [biosample_summary="Homo sapiens lung tissue male child (3 years)" and target="H3K4me3"]
|
 |
[1.67, 66] |
|
n counts base pairs; sd is the population standard deviation.
Coverage
| Chromosome | Covered positions | Covered % | Segments |
|---|---|---|---|
| all chromosomes | 36798955 | 1.14% | 26897 |
| chr1 | 3619011 | 1.45% | 2645 |
| chr2 | 2577118 | 1.06% | 1838 |
| chr3 | 2165198 | 1.09% | 1545 |
| chr4 | 1645114 | 0.86% | 1171 |
| chr5 | 1883182 | 1.04% | 1329 |
| chr6 | 2165210 | 1.27% | 1514 |
| chr7 | 1806604 | 1.13% | 1357 |
| chr8 | 1418438 | 0.98% | 1024 |
| chr9 | 1492395 | 1.08% | 1100 |
| chr10 | 1641114 | 1.23% | 1166 |
| chr11 | 1912112 | 1.42% | 1337 |
| chr12 | 1935962 | 1.45% | 1372 |
| chr13 | 823425 | 0.72% | 571 |
| chr14 | 1197154 | 1.12% | 838 |
| chr15 | 1206498 | 1.18% | 880 |
| chr16 | 1321831 | 1.46% | 984 |
| chr17 | 1962045 | 2.36% | 1449 |
| chr18 | 664936 | 0.83% | 467 |
| chr19 | 2154857 | 3.68% | 1853 |
| chr20 | 923531 | 1.43% | 678 |
| chr21 | 336807 | 0.72% | 253 |
| chr22 | 752581 | 1.48% | 564 |
| chrX | 1153468 | 0.74% | 934 |
| chrY | 40364 | 0.07% | 28 |
| 3342 contigs with no values (129077085 bp) | 0 | 0.00% | 0 |
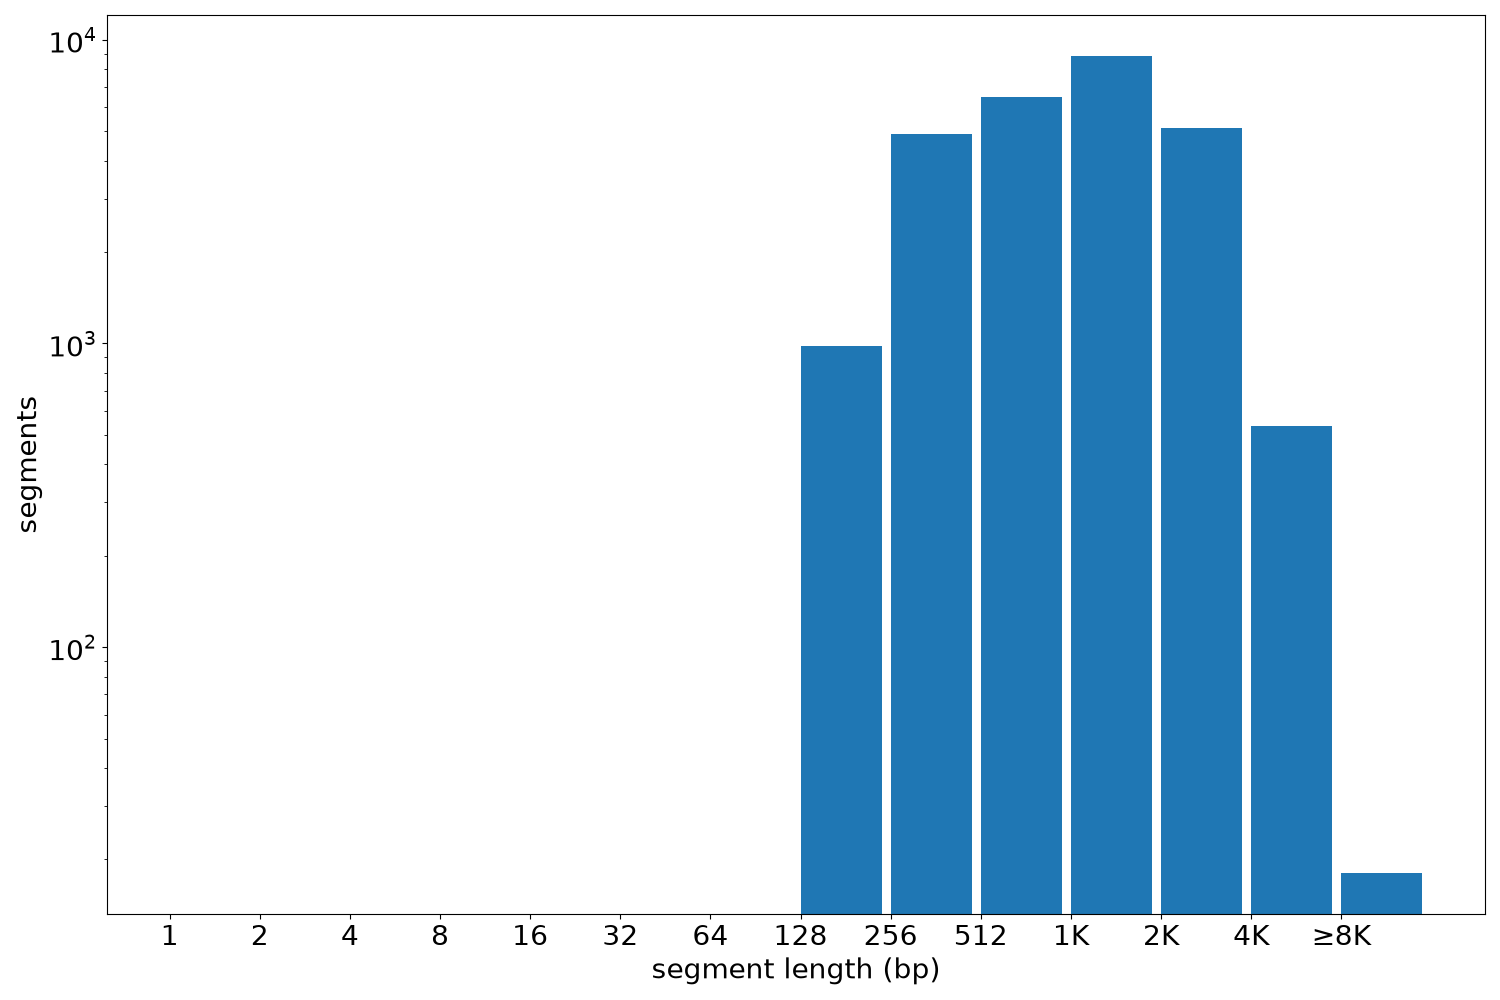
Segment lengths
| segments | min | max | mean | median | |
|---|---|---|---|---|---|
| segments | 26897 | 180 | 11909 | 1368.14 | 1123 |
Files
| Filename | Size | md5 |
|---|---|---|
| ENCFF526QUJ.bed.gz | 736.44 KB | 1ceb900e51b9361b86dd20b648c034b1 |
| ENCFF526QUJ.tabix.bed.gz | 312.27 KB | 6c2010f27ae7d7655ea47344f7725911 |
| ENCFF526QUJ.tabix.bed.gz.tbi | 157.94 KB | 330d41c5caefdfd9a746fac5d945e665 |
| genomic_resource.yaml | 3.14 KB | 6afbf7bcaae61468c2d4eac0f56238f1 |
| statistics/ |