Resource
| Id | Histone_ChIP-seq/ENCSR481YGZ |
|---|---|
| Type | position_score |
| Version | 0 |
| Summary | Histone_ChIP-seq ENCSR481YGZ [biosample_summary="Homo sapiens foreskin melanocyte male newborn" and target="H3K4me3"] |
| Description |
status: released biological_replicates: Rep 1 summary: male newborn output_type: pseudoreplicated peaks audit_internal_action: Archived analysis {ENCAN735APL|/analyses/ENCAN735APL/} has in progress subobject quality standard {encode3-histone-chip|/quality-standards/encode3-histone-chip/} audit_warning: PBC1 (PCR Bottlenecking Coefficient 1, M1/M_distinct) is the ratio of the number of genomic locations where exactly one read maps uniquely (M1) to the number of genomic locations where some reads map (M_distinct). A PBC1 value in the range 0 - 0.5 is severe bottlenecking, 0.5 - 0.8 is moderate bottlenecking, 0.8 - 0.9 is mild bottlenecking, and > 0.9 is no bottlenecking. PBC1 value > 0.9 is recommended, but > 0.8 is acceptable. ENCODE processed redacted alignments file {ENCFF102MOJ|/files/ENCFF102MOJ/} processed by ChIP-seq ENCODE3 hg19 pipeline was generated from a library with PBC1 value of 0.83. audit_warning: PBC2 (PCR Bottlenecking Coefficient 2, M1/M2) is the ratio of the number of genomic locations where exactly one read maps uniquely (M1) to the number of genomic locations where two reads map uniquely (M2). A PBC2 value in the range 0 - 1 is severe bottlenecking, 1 - 3 is moderate bottlenecking, 3 - 10 is mild bottlenecking, > 10 is no bottlenecking. PBC2 value > 10 is recommended, but > 3 is acceptable. ENCODE processed redacted alignments file {ENCFF102MOJ|/files/ENCFF102MOJ/} processed by ChIP-seq ENCODE3 hg19 pipeline was generated from a library with PBC2 value of 6.60. |
| Labels |
|
Scores (1)
| ID | Type | Default annotation | Description | Histogram | Range | Summary |
|---|---|---|---|---|---|---|
| Histone_ChIP-seq_ENCSR481YGZ | float |
Histone_ChIP-seq_ENCSR481YGZ |
Histone_ChIP-seq ENCSR481YGZ [biosample_summary="Homo sapiens foreskin melanocyte male newborn" and target="H3K4me3"]
|
 |
[1.83, 95.5] |
|
n counts base pairs; sd is the population standard deviation.
Coverage
| Chromosome | Covered positions | Covered % | Segments |
|---|---|---|---|
| all chromosomes | 56068743 | 1.74% | 40612 |
| chr1 | 5448877 | 2.19% | 3896 |
| chr2 | 3794018 | 1.57% | 2784 |
| chr3 | 2942860 | 1.48% | 2115 |
| chr4 | 2071755 | 1.09% | 1525 |
| chr5 | 2472257 | 1.36% | 1812 |
| chr6 | 3145241 | 1.84% | 2234 |
| chr7 | 2619119 | 1.64% | 1937 |
| chr8 | 2082387 | 1.43% | 1527 |
| chr9 | 2344767 | 1.69% | 1725 |
| chr10 | 2344034 | 1.75% | 1833 |
| chr11 | 3155795 | 2.34% | 2193 |
| chr12 | 2921816 | 2.19% | 2022 |
| chr13 | 1132033 | 0.99% | 877 |
| chr14 | 1739018 | 1.62% | 1206 |
| chr15 | 1948372 | 1.91% | 1458 |
| chr16 | 2420697 | 2.68% | 1757 |
| chr17 | 3583403 | 4.30% | 2501 |
| chr18 | 989949 | 1.23% | 793 |
| chr19 | 3938887 | 6.72% | 2748 |
| chr20 | 1481491 | 2.30% | 1146 |
| chr21 | 547003 | 1.17% | 450 |
| chr22 | 1373280 | 2.70% | 1029 |
| chrX | 1522102 | 0.98% | 1008 |
| chrY | 49582 | 0.09% | 36 |
| 3342 contigs with no values (129077085 bp) | 0 | 0.00% | 0 |
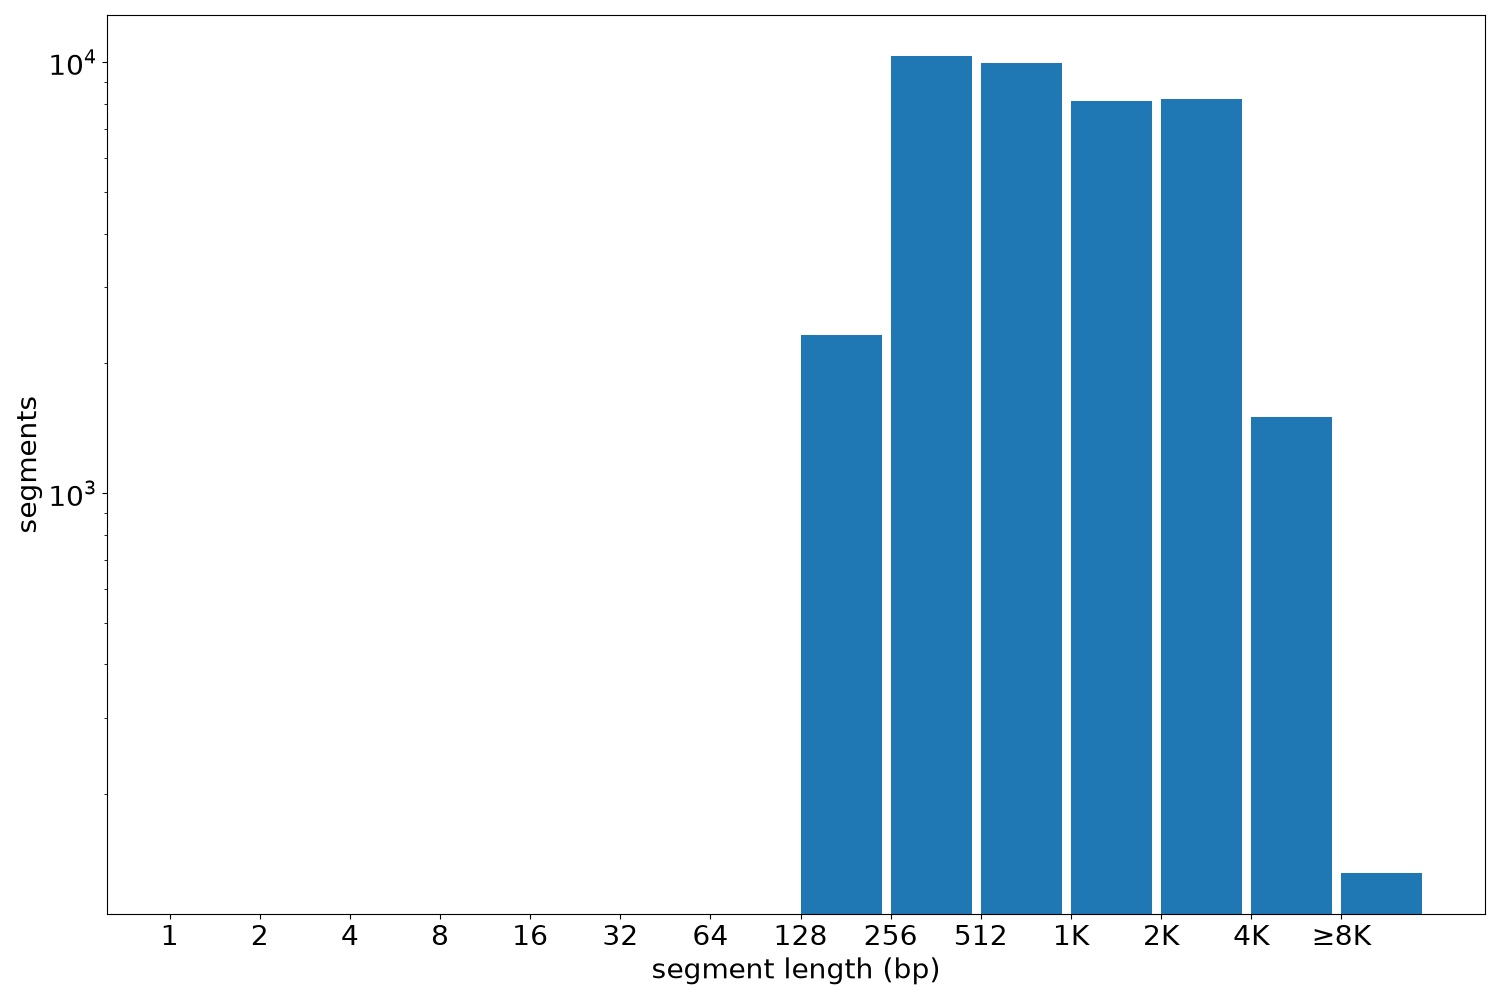
Segment lengths
| segments | min | max | mean | median | |
|---|---|---|---|---|---|
| segments | 40612 | 185 | 23233 | 1380.6 | 851 |
Files
| Filename | Size | md5 |
|---|---|---|
| ENCFF499KTB.bed.gz | 946.84 KB | 9339130e12a34cdfde557e9386261d85 |
| ENCFF499KTB.tabix.bed.gz | 435.82 KB | 356961045d9bcc9472d03ac78204b70c |
| ENCFF499KTB.tabix.bed.gz.tbi | 197.69 KB | 2687a920bf32dc7400603e9eb255d2ba |
| genomic_resource.yaml | 2.73 KB | f7e8d75ff85074134973448b13c02ac0 |
| statistics/ |