Resource
| Id | Histone_ChIP-seq/ENCSR461HUD |
|---|---|
| Type | position_score |
| Version | 0 |
| Summary | Histone_ChIP-seq ENCSR461HUD [biosample_summary="Homo sapiens PC-3" and target="H3F3A"] |
| Description |
status: released biological_replicates: Rep 1 summary: output_type: pseudoreplicated peaks audit_internal_action: Archived analysis {ENCAN630BQD|/analyses/ENCAN630BQD/} has in progress subobject quality standard {encode3-histone-chip|/quality-standards/encode3-histone-chip/} audit_warning: PBC1 (PCR Bottlenecking Coefficient 1, M1/M_distinct) is the ratio of the number of genomic locations where exactly one read maps uniquely (M1) to the number of genomic locations where some reads map (M_distinct). A PBC1 value in the range 0 - 0.5 is severe bottlenecking, 0.5 - 0.8 is moderate bottlenecking, 0.8 - 0.9 is mild bottlenecking, and > 0.9 is no bottlenecking. PBC1 value > 0.9 is recommended, but > 0.8 is acceptable. ENCODE processed alignments file {ENCFF504OYD|/files/ENCFF504OYD/} processed by ChIP-seq ENCODE3 hg19 pipeline was generated from a library with PBC1 value of 0.88. audit_warning: PBC2 (PCR Bottlenecking Coefficient 2, M1/M2) is the ratio of the number of genomic locations where exactly one read maps uniquely (M1) to the number of genomic locations where two reads map uniquely (M2). A PBC2 value in the range 0 - 1 is severe bottlenecking, 1 - 3 is moderate bottlenecking, 3 - 10 is mild bottlenecking, > 10 is no bottlenecking. PBC2 value > 10 is recommended, but > 3 is acceptable. ENCODE processed alignments file {ENCFF504OYD|/files/ENCFF504OYD/} processed by ChIP-seq ENCODE3 hg19 pipeline was generated from a library with PBC2 value of 8.25. |
| Labels |
|
Scores (1)
| ID | Type | Default annotation | Description | Histogram | Range | Summary |
|---|---|---|---|---|---|---|
| Histone_ChIP-seq_ENCSR461HUD | float |
Histone_ChIP-seq_ENCSR461HUD |
Histone_ChIP-seq ENCSR461HUD [biosample_summary="Homo sapiens PC-3" and target="H3F3A"]
|
 |
[1.5, 9.4] |
|
n counts base pairs; sd is the population standard deviation.
Coverage
| Chromosome | Covered positions | Covered % | Segments |
|---|---|---|---|
| all chromosomes | 7494675 | 0.23% | 15645 |
| chr1 | 898113 | 0.36% | 1882 |
| chr2 | 626614 | 0.26% | 1379 |
| chr3 | 574727 | 0.29% | 1239 |
| chr4 | 255174 | 0.13% | 590 |
| chr5 | 411251 | 0.23% | 840 |
| chr6 | 331817 | 0.19% | 760 |
| chr7 | 280520 | 0.18% | 621 |
| chr8 | 658423 | 0.45% | 1239 |
| chr9 | 146864 | 0.11% | 344 |
| chr10 | 552963 | 0.41% | 1006 |
| chr11 | 463258 | 0.34% | 903 |
| chr12 | 487638 | 0.37% | 995 |
| chr13 | 101340 | 0.09% | 237 |
| chr14 | 310905 | 0.29% | 628 |
| chr15 | 241892 | 0.24% | 493 |
| chr16 | 60482 | 0.07% | 137 |
| chr17 | 325957 | 0.39% | 659 |
| chr18 | 114619 | 0.14% | 266 |
| chr19 | 127936 | 0.22% | 296 |
| chr20 | 242733 | 0.38% | 489 |
| chr21 | 102481 | 0.22% | 220 |
| chr22 | 53902 | 0.11% | 133 |
| chrX | 125066 | 0.08% | 289 |
| 3343 contigs with no values (186304500 bp) | 0 | 0.00% | 0 |
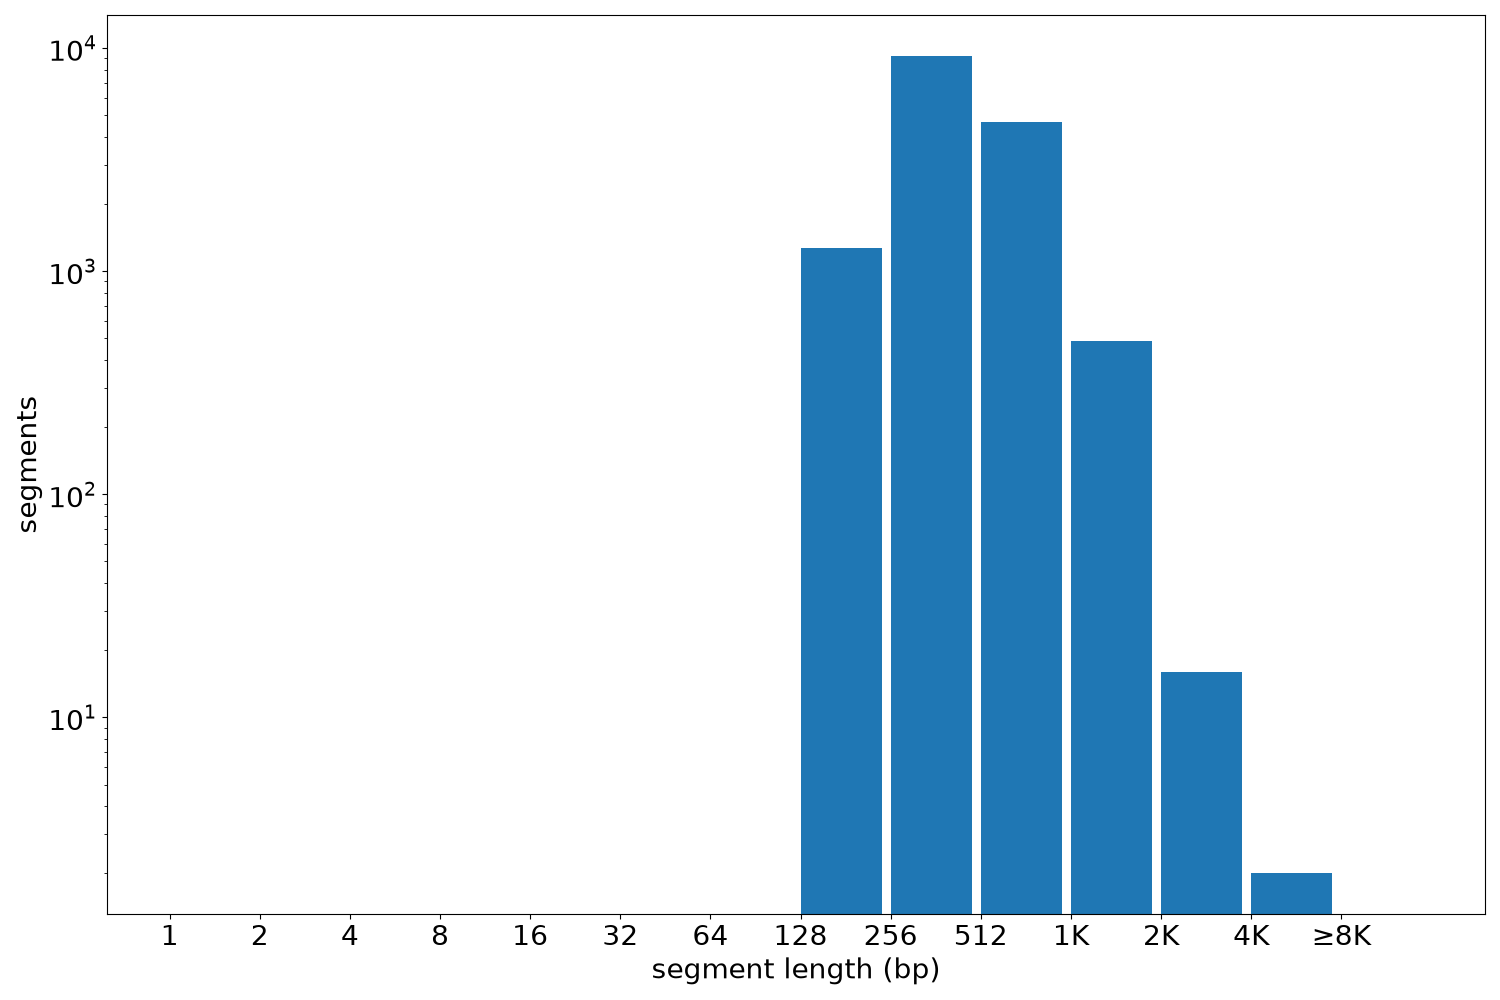
Segment lengths
| segments | min | max | mean | median | |
|---|---|---|---|---|---|
| segments | 15645 | 200 | 4253 | 479.05 | 419 |
Files
| Filename | Size | md5 |
|---|---|---|
| ENCFF668JHY.bed.gz | 344.59 KB | a0e2ef44272b800ca2d1abc336e7eecb |
| ENCFF668JHY.tabix.bed.gz | 165.65 KB | 4fc78b2301638180dd1d0184b6859ae6 |
| ENCFF668JHY.tabix.bed.gz.tbi | 98.23 KB | 4ffeead84a54a29ed3d25adaa8059946 |
| genomic_resource.yaml | 2.71 KB | 05cd99a263a783c7c02c2633c5500c5c |
| statistics/ |