Resource
| Id | Histone_ChIP-seq/ENCSR453GNY |
|---|---|
| Type | position_score |
| Version | 0 |
| Summary | Histone_ChIP-seq ENCSR453GNY [biosample_summary="Homo sapiens CD4-positive, alpha-beta T cell" and target="H3K9me3"] |
| Description |
status: released biological_replicates: Rep 1, Rep 2 summary: output_type: replicated peaks audit_internal_action: Archived analysis {ENCAN809ZWL|/analyses/ENCAN809ZWL/} has in progress subobject quality standard {encode3-histone-chip|/quality-standards/encode3-histone-chip/} audit_not_compliant: Processed unfiltered alignments file {ENCFF810ZXM|/files/ENCFF810ZXM/} processed by ChIP-seq ENCODE3 hg19 pipeline has 34769293 mapped reads. The minimum ENCODE standard for each replicate in a ChIP-seq experiment targeting H3K9me3-human and investigated as a broad histone mark is 35 million mapped reads. The recommended value is > 45 million, but > 35 million is acceptable. (See {ENCODE ChIP-seq data standards|/data-standards/chip-seq/}) audit_not_compliant: Processed redacted unfiltered alignments file {ENCFF971ENT|/files/ENCFF971ENT/} processed by ChIP-seq ENCODE3 hg19 pipeline has 26966218 mapped reads. The minimum ENCODE standard for each replicate in a ChIP-seq experiment targeting H3K9me3-human and investigated as a broad histone mark is 35 million mapped reads. The recommended value is > 45 million, but > 35 million is acceptable. (See {ENCODE ChIP-seq data standards|/data-standards/chip-seq/}) audit_warning: PBC1 (PCR Bottlenecking Coefficient 1, M1/M_distinct) is the ratio of the number of genomic locations where exactly one read maps uniquely (M1) to the number of genomic locations where some reads map (M_distinct). A PBC1 value in the range 0 - 0.5 is severe bottlenecking, 0.5 - 0.8 is moderate bottlenecking, 0.8 - 0.9 is mild bottlenecking, and > 0.9 is no bottlenecking. PBC1 value > 0.9 is recommended, but > 0.8 is acceptable. ENCODE processed alignments file {ENCFF803BLL|/files/ENCFF803BLL/} processed by ChIP-seq ENCODE3 hg19 pipeline was generated from a library with PBC1 value of 0.82. audit_warning: PBC2 (PCR Bottlenecking Coefficient 2, M1/M2) is the ratio of the number of genomic locations where exactly one read maps uniquely (M1) to the number of genomic locations where two reads map uniquely (M2). A PBC2 value in the range 0 - 1 is severe bottlenecking, 1 - 3 is moderate bottlenecking, 3 - 10 is mild bottlenecking, > 10 is no bottlenecking. PBC2 value > 10 is recommended, but > 3 is acceptable. ENCODE processed alignments file {ENCFF803BLL|/files/ENCFF803BLL/} processed by ChIP-seq ENCODE3 hg19 pipeline was generated from a library with PBC2 value of 5.50. audit_warning: PBC1 (PCR Bottlenecking Coefficient 1, M1/M_distinct) is the ratio of the number of genomic locations where exactly one read maps uniquely (M1) to the number of genomic locations where some reads map (M_distinct). A PBC1 value in the range 0 - 0.5 is severe bottlenecking, 0.5 - 0.8 is moderate bottlenecking, 0.8 - 0.9 is mild bottlenecking, and > 0.9 is no bottlenecking. PBC1 value > 0.9 is recommended, but > 0.8 is acceptable. ENCODE processed redacted alignments file {ENCFF041XFT|/files/ENCFF041XFT/} processed by ChIP-seq ENCODE3 hg19 pipeline was generated from a library with PBC1 value of 0.84. audit_warning: PBC2 (PCR Bottlenecking Coefficient 2, M1/M2) is the ratio of the number of genomic locations where exactly one read maps uniquely (M1) to the number of genomic locations where two reads map uniquely (M2). A PBC2 value in the range 0 - 1 is severe bottlenecking, 1 - 3 is moderate bottlenecking, 3 - 10 is mild bottlenecking, > 10 is no bottlenecking. PBC2 value > 10 is recommended, but > 3 is acceptable. ENCODE processed redacted alignments file {ENCFF041XFT|/files/ENCFF041XFT/} processed by ChIP-seq ENCODE3 hg19 pipeline was generated from a library with PBC2 value of 6.30. |
| Labels |
|
Scores (1)
| ID | Type | Default annotation | Description | Histogram | Range | Summary |
|---|---|---|---|---|---|---|
| Histone_ChIP-seq_ENCSR453GNY | float |
Histone_ChIP-seq_ENCSR453GNY |
Histone_ChIP-seq ENCSR453GNY [biosample_summary="Homo sapiens CD4-positive, alpha-beta T cell" and target="H3K9me3"]
|
 |
[1.52, 15.1] |
|
n counts base pairs; sd is the population standard deviation.
Coverage
| Chromosome | Covered positions | Covered % | Segments |
|---|---|---|---|
| all chromosomes | 27517782 | 0.86% | 35352 |
| chr1 | 1731436 | 0.70% | 2255 |
| chr2 | 1787214 | 0.74% | 2555 |
| chr3 | 1450265 | 0.73% | 2054 |
| chr4 | 1589488 | 0.84% | 2279 |
| chr5 | 1786522 | 0.98% | 2458 |
| chr6 | 1177294 | 0.69% | 1656 |
| chr7 | 1699420 | 1.07% | 2221 |
| chr8 | 1297402 | 0.89% | 1854 |
| chr9 | 998798 | 0.72% | 1348 |
| chr10 | 1268349 | 0.95% | 1586 |
| chr11 | 1183700 | 0.88% | 1739 |
| chr12 | 1301637 | 0.98% | 1598 |
| chr13 | 732978 | 0.64% | 1135 |
| chr14 | 836893 | 0.78% | 1256 |
| chr15 | 742677 | 0.73% | 906 |
| chr16 | 1091995 | 1.21% | 1480 |
| chr17 | 464983 | 0.56% | 600 |
| chr18 | 542261 | 0.67% | 808 |
| chr19 | 4236715 | 7.23% | 3492 |
| chr20 | 444997 | 0.69% | 601 |
| chr21 | 453055 | 0.97% | 520 |
| chr22 | 240786 | 0.47% | 289 |
| chrX | 396363 | 0.25% | 577 |
| chrY | 62554 | 0.11% | 85 |
| 3342 contigs with no values (129077085 bp) | 0 | 0.00% | 0 |
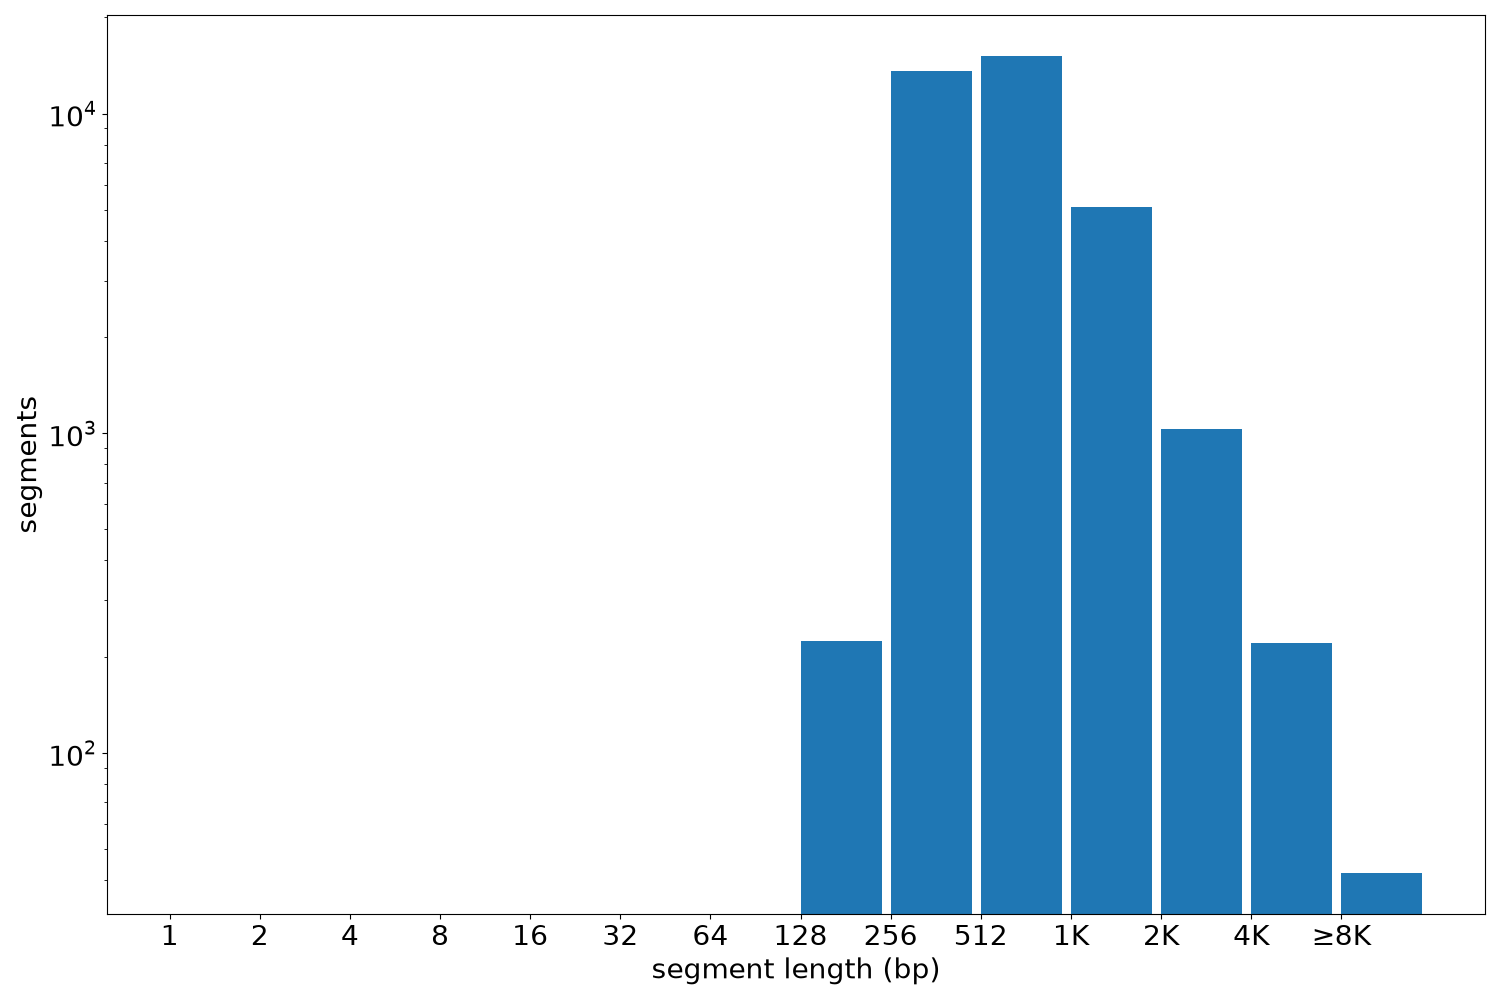
Segment lengths
| segments | min | max | mean | median | |
|---|---|---|---|---|---|
| segments | 35352 | 225 | 38812 | 778.39 | 589 |
Files
| Filename | Size | md5 |
|---|---|---|
| ENCFF491CKX.bed.gz | 721.05 KB | 1b039e8687e06dd862ff3332a083c4ee |
| ENCFF491CKX.tabix.bed.gz | 361.95 KB | eb7481d72c7d443383f653e22fab943a |
| ENCFF491CKX.tabix.bed.gz.tbi | 178.91 KB | eacf8d16ab1374b7340defdf8351c609 |
| genomic_resource.yaml | 5.16 KB | ab9d067d9d82f46156b341b206414c1c |
| statistics/ |