Resource
| Id | Histone_ChIP-seq/ENCSR360UUM |
|---|---|
| Type | position_score |
| Version | 0 |
| Summary | Histone_ChIP-seq ENCSR360UUM [biosample_summary="Homo sapiens tibial artery tissue female adult (51 years)" and target="H3K36me3"] |
| Description |
status: released biological_replicates: Rep 1 summary: female adult (51 years) output_type: pseudoreplicated peaks audit_internal_action: Released analysis {ENCAN051YBT|/analyses/ENCAN051YBT/} has in progress subobject quality standard {encode4-histone-chip|/quality-standards/encode4-histone-chip/} audit_internal_action: Released analysis {ENCAN051YBT|/analyses/ENCAN051YBT/} has in progress subobject document {73914d1f-49b6-4bd7-adf3-bae86c947f92|/documents/73914d1f-49b6-4bd7-adf3-bae86c947f92/} audit_warning: PBC1 (PCR Bottlenecking Coefficient 1, M1/M_distinct) is the ratio of the number of genomic locations where exactly one read maps uniquely (M1) to the number of genomic locations where some reads map (M_distinct). A PBC1 value in the range 0 - 0.5 is severe bottlenecking, 0.5 - 0.8 is moderate bottlenecking, 0.8 - 0.9 is mild bottlenecking, and > 0.9 is no bottlenecking. PBC1 value > 0.9 is recommended, but > 0.8 is acceptable. ENCODE processed alignments file {ENCFF852ADS|/files/ENCFF852ADS/} processed by ChIP-seq ENCODE4 v1.5.1 GRCh38 pipeline was generated from a library with PBC1 value of 0.88. audit_warning: PBC2 (PCR Bottlenecking Coefficient 2, M1/M2) is the ratio of the number of genomic locations where exactly one read maps uniquely (M1) to the number of genomic locations where two reads map uniquely (M2). A PBC2 value in the range 0 - 1 is severe bottlenecking, 1 - 3 is moderate bottlenecking, 3 - 10 is mild bottlenecking, > 10 is no bottlenecking. PBC2 value > 10 is recommended, but > 3 is acceptable. ENCODE processed alignments file {ENCFF852ADS|/files/ENCFF852ADS/} processed by ChIP-seq ENCODE4 v1.5.1 GRCh38 pipeline was generated from a library with PBC2 value of 8.19. |
| Labels |
|
Scores (1)
| ID | Type | Default annotation | Description | Histogram | Range | Summary |
|---|---|---|---|---|---|---|
| Histone_ChIP-seq_ENCSR360UUM | float |
Histone_ChIP-seq_ENCSR360UUM |
Histone_ChIP-seq ENCSR360UUM [biosample_summary="Homo sapiens tibial artery tissue female adult (51 years)" and target="H3K36me3"]
|
 |
[1.61, 20.3] |
|
n counts base pairs; sd is the population standard deviation.
Coverage
| Chromosome | Covered positions | Covered % | Segments |
|---|---|---|---|
| all chromosomes | 177608328 | 5.52% | 94948 |
| chr1 | 17539455 | 7.05% | 9085 |
| chr2 | 13707600 | 5.66% | 8140 |
| chr3 | 11198612 | 5.65% | 6468 |
| chr4 | 7129821 | 3.75% | 4492 |
| chr5 | 8165723 | 4.50% | 4716 |
| chr6 | 7873736 | 4.61% | 4779 |
| chr7 | 8319590 | 5.22% | 4741 |
| chr8 | 6089835 | 4.20% | 3720 |
| chr9 | 7913633 | 5.72% | 4172 |
| chr10 | 7947872 | 5.94% | 4514 |
| chr11 | 9256760 | 6.85% | 4484 |
| chr12 | 9578464 | 7.19% | 4714 |
| chr13 | 3663462 | 3.20% | 2478 |
| chr14 | 6227163 | 5.82% | 3403 |
| chr15 | 6805066 | 6.67% | 3774 |
| chr16 | 7952828 | 8.80% | 3342 |
| chr17 | 10132205 | 12.17% | 4601 |
| chr18 | 2972729 | 3.70% | 2007 |
| chr19 | 10678584 | 18.22% | 4026 |
| chr20 | 5320583 | 8.26% | 2511 |
| chr21 | 2040318 | 4.37% | 1020 |
| chr22 | 4602088 | 9.06% | 1910 |
| chrX | 2492201 | 1.60% | 1851 |
| 3343 contigs with no values (186304500 bp) | 0 | 0.00% | 0 |
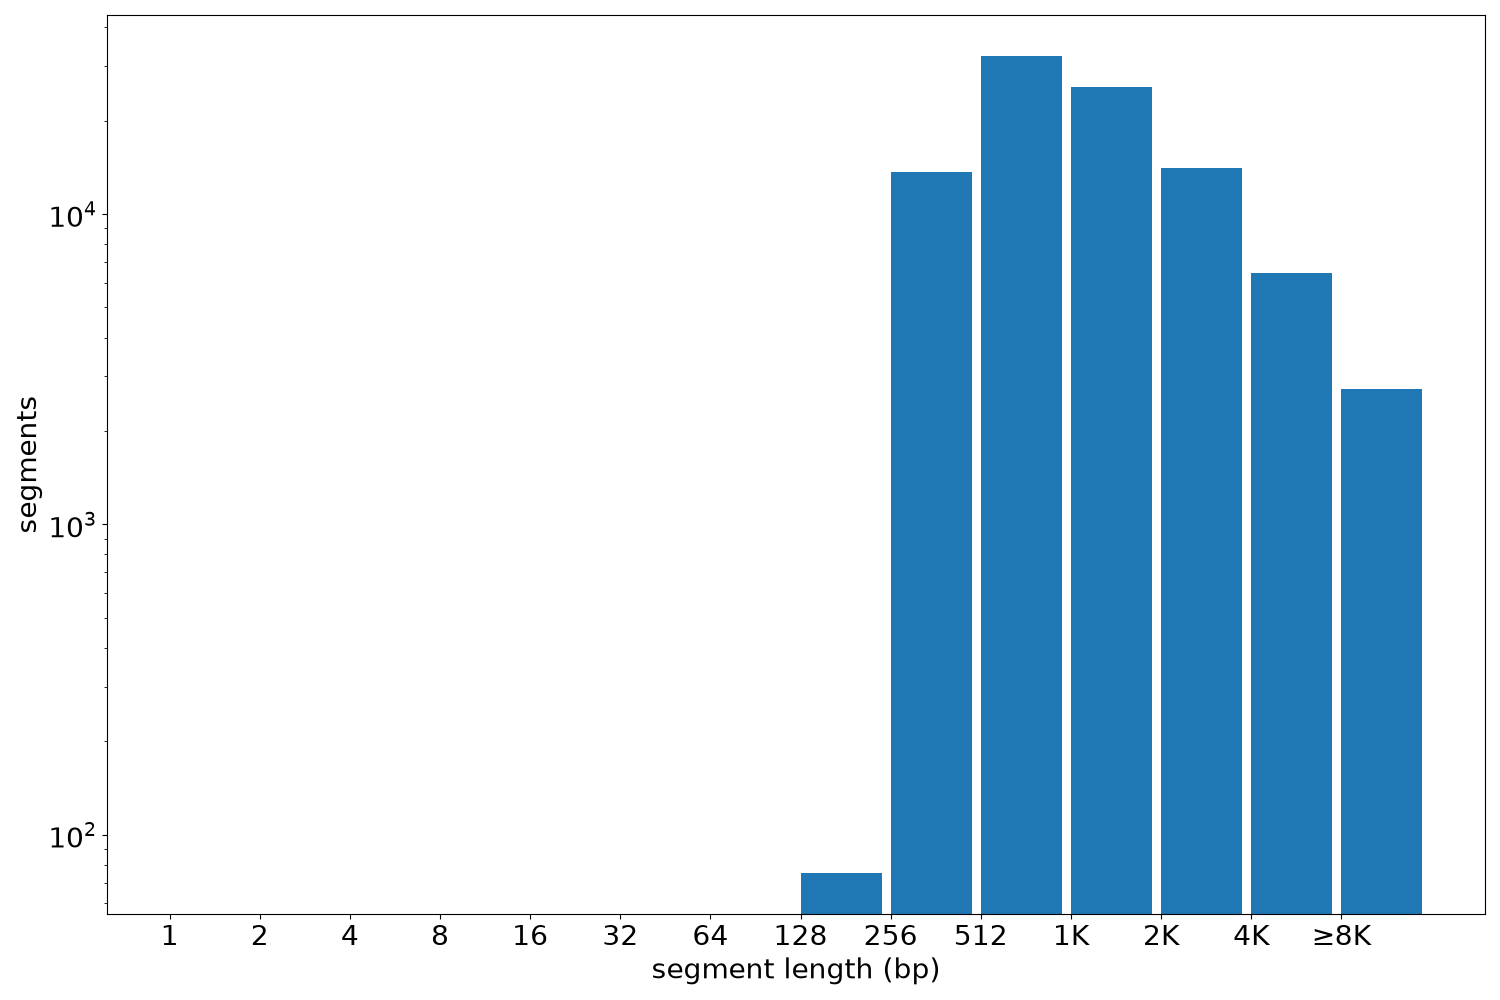
Segment lengths
| segments | min | max | mean | median | |
|---|---|---|---|---|---|
| segments | 94948 | 230 | 59652 | 1870.59 | 1055 |
Files
| Filename | Size | md5 |
|---|---|---|
| ENCFF976LEF.bed.gz | 2.07 MB | 7fba001bac807c445b8deffb3634328b |
| ENCFF976LEF.tabix.bed.gz | 995.18 KB | c067d7de13d0d0cc16ce467592dd567d |
| ENCFF976LEF.tabix.bed.gz.tbi | 155.42 KB | 57fa201b809c92f9d101a4419ab476e5 |
| genomic_resource.yaml | 3.0 KB | 99ab6c44a526ac309f2a4bd372914622 |
| statistics/ |