Resource
| Id | Histone_ChIP-seq/ENCSR334DRN |
|---|---|
| Type | position_score |
| Version | 0 |
| Summary | Histone_ChIP-seq ENCSR334DRN [biosample_summary="Homo sapiens skin epidermis tissue male adult (67 years)" and target="H3K27ac"] |
| Description |
status: released biological_replicates: Rep 1 summary: male adult (67 years) output_type: pseudoreplicated peaks audit_internal_action: Released analysis {ENCAN403FYQ|/analyses/ENCAN403FYQ/} has in progress subobject quality standard {encode4-histone-chip|/quality-standards/encode4-histone-chip/} audit_internal_action: Released analysis {ENCAN403FYQ|/analyses/ENCAN403FYQ/} has in progress subobject document {4c05ca7b-5119-4979-907f-b9d27c9fb68c|/documents/4c05ca7b-5119-4979-907f-b9d27c9fb68c/} audit_warning: PBC1 (PCR Bottlenecking Coefficient 1, M1/M_distinct) is the ratio of the number of genomic locations where exactly one read maps uniquely (M1) to the number of genomic locations where some reads map (M_distinct). A PBC1 value in the range 0 - 0.5 is severe bottlenecking, 0.5 - 0.8 is moderate bottlenecking, 0.8 - 0.9 is mild bottlenecking, and > 0.9 is no bottlenecking. PBC1 value > 0.9 is recommended, but > 0.8 is acceptable. ENCODE processed alignments file {ENCFF647VPO|/files/ENCFF647VPO/} processed by ChIP-seq ENCODE4 v1.5.0 GRCh38 pipeline was generated from a library with PBC1 value of 0.88. audit_warning: PBC2 (PCR Bottlenecking Coefficient 2, M1/M2) is the ratio of the number of genomic locations where exactly one read maps uniquely (M1) to the number of genomic locations where two reads map uniquely (M2). A PBC2 value in the range 0 - 1 is severe bottlenecking, 1 - 3 is moderate bottlenecking, 3 - 10 is mild bottlenecking, > 10 is no bottlenecking. PBC2 value > 10 is recommended, but > 3 is acceptable. ENCODE processed alignments file {ENCFF647VPO|/files/ENCFF647VPO/} processed by ChIP-seq ENCODE4 v1.5.0 GRCh38 pipeline was generated from a library with PBC2 value of 8.17. |
| Labels |
|
Scores (1)
| ID | Type | Default annotation | Description | Histogram | Range | Summary |
|---|---|---|---|---|---|---|
| Histone_ChIP-seq_ENCSR334DRN | float |
Histone_ChIP-seq_ENCSR334DRN |
Histone_ChIP-seq ENCSR334DRN [biosample_summary="Homo sapiens skin epidermis tissue male adult (67 years)" and target="H3K27ac"]
|
 |
[1.75, 71.7] |
|
n counts base pairs; sd is the population standard deviation.
Coverage
| Chromosome | Covered positions | Covered % | Segments |
|---|---|---|---|
| all chromosomes | 59144885 | 1.84% | 48447 |
| chr1 | 6342201 | 2.55% | 5033 |
| chr2 | 4182973 | 1.73% | 3641 |
| chr3 | 3388822 | 1.71% | 2909 |
| chr4 | 1659265 | 0.87% | 1457 |
| chr5 | 2522415 | 1.39% | 2136 |
| chr6 | 3037362 | 1.78% | 2584 |
| chr7 | 2348039 | 1.47% | 2034 |
| chr8 | 2053086 | 1.41% | 1760 |
| chr9 | 2761204 | 2.00% | 2207 |
| chr10 | 2801993 | 2.09% | 2337 |
| chr11 | 3406191 | 2.52% | 2628 |
| chr12 | 3149582 | 2.36% | 2483 |
| chr13 | 1016508 | 0.89% | 943 |
| chr14 | 2176119 | 2.03% | 1718 |
| chr15 | 2065458 | 2.03% | 1713 |
| chr16 | 2431263 | 2.69% | 2019 |
| chr17 | 4001319 | 4.81% | 3009 |
| chr18 | 939809 | 1.17% | 848 |
| chr19 | 3587111 | 6.12% | 2613 |
| chr20 | 1812159 | 2.81% | 1492 |
| chr21 | 744277 | 1.59% | 651 |
| chr22 | 1765852 | 3.47% | 1370 |
| chrX | 925718 | 0.59% | 841 |
| chrY | 26159 | 0.05% | 21 |
| 3342 contigs with no values (129077085 bp) | 0 | 0.00% | 0 |
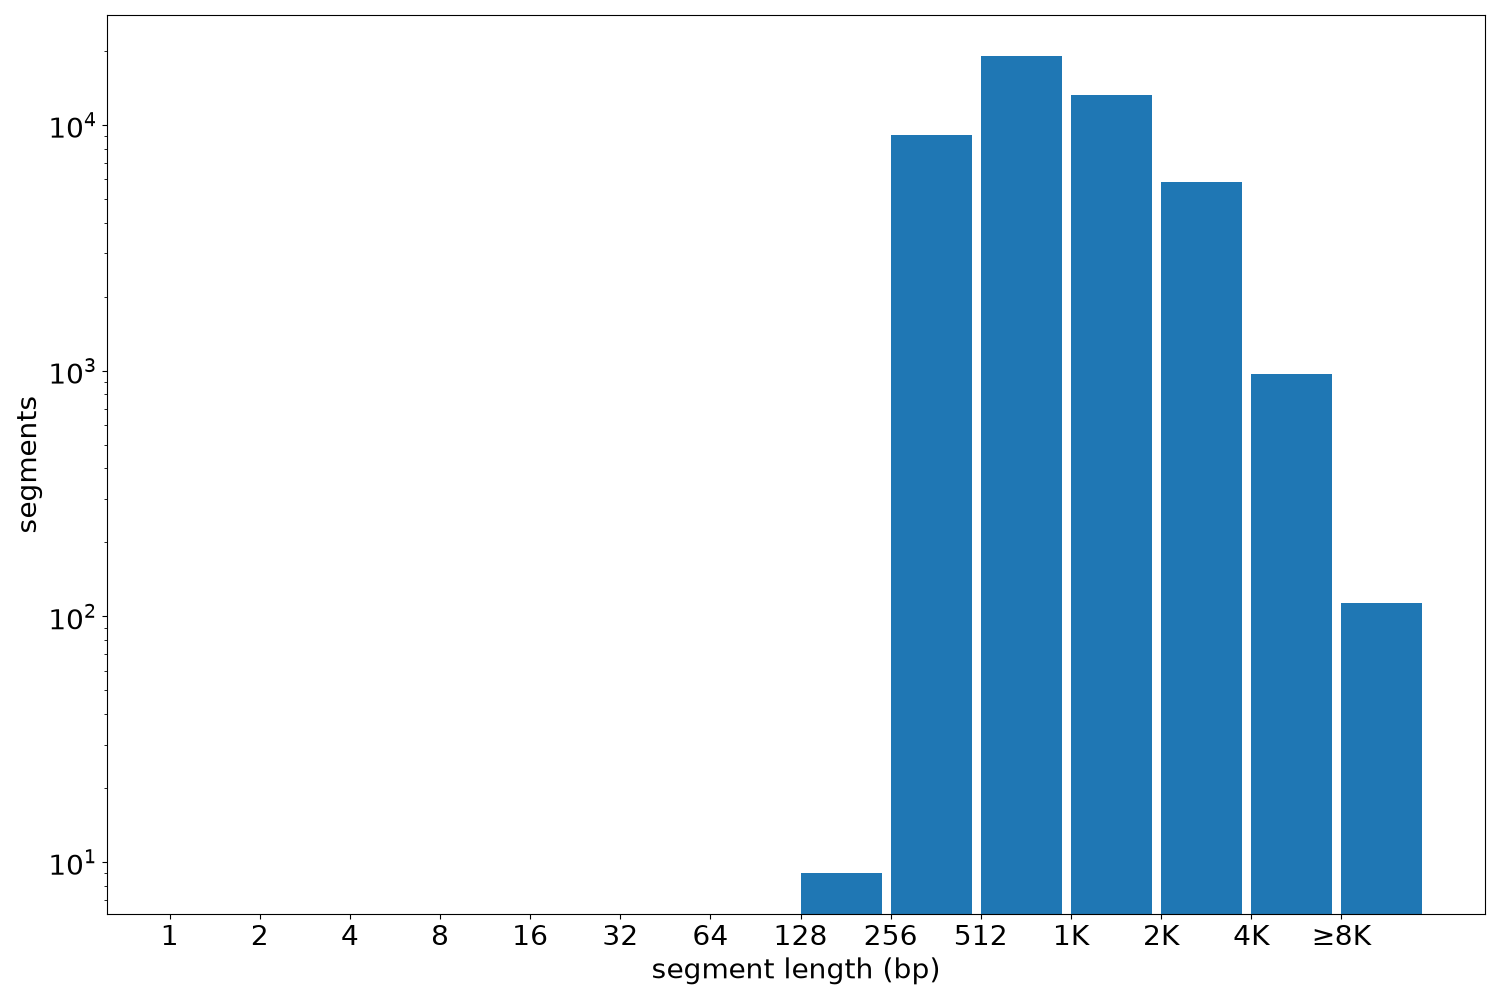
Segment lengths
| segments | min | max | mean | median | |
|---|---|---|---|---|---|
| segments | 48447 | 255 | 25109 | 1220.82 | 877 |
Files
| Filename | Size | md5 |
|---|---|---|
| ENCFF462XVH.bed.gz | 1.16 MB | 1f4f7b2193e81fcba686ccf28bbfaa3a |
| ENCFF462XVH.tabix.bed.gz | 532.22 KB | 8fc8baa67d0496b5c4846f8e31eb97fc |
| ENCFF462XVH.tabix.bed.gz.tbi | 187.31 KB | 742aa91064a3a350458c98567e49b3ae |
| genomic_resource.yaml | 2.99 KB | 5a0c901966a078c14f87f3e5684b990f |
| statistics/ |