Resource
| Id | Histone_ChIP-seq/ENCSR316KHQ |
|---|---|
| Type | position_score |
| Version | 0 |
| Summary | Histone_ChIP-seq ENCSR316KHQ [biosample_summary="Homo sapiens SU-DHL-6" and target="H3K36me3"] |
| Description |
status: released biological_replicates: Rep 1, Rep 2 summary: output_type: pseudoreplicated peaks audit_internal_action: Released analysis {ENCAN592FZI|/analyses/ENCAN592FZI/} has in progress subobject quality standard {encode4-histone-chip|/quality-standards/encode4-histone-chip/} audit_internal_action: Released analysis {ENCAN592FZI|/analyses/ENCAN592FZI/} has in progress subobject document {41baf627-8bd0-4ffd-8018-74ec0d075054|/documents/41baf627-8bd0-4ffd-8018-74ec0d075054/} audit_warning: PBC1 (PCR Bottlenecking Coefficient 1, M1/M_distinct) is the ratio of the number of genomic locations where exactly one read maps uniquely (M1) to the number of genomic locations where some reads map (M_distinct). A PBC1 value in the range 0 - 0.5 is severe bottlenecking, 0.5 - 0.8 is moderate bottlenecking, 0.8 - 0.9 is mild bottlenecking, and > 0.9 is no bottlenecking. PBC1 value > 0.9 is recommended, but > 0.8 is acceptable. ENCODE processed alignments file {ENCFF444SAY|/files/ENCFF444SAY/} processed by ChIP-seq ENCODE4 v1.6.1 GRCh38 pipeline was generated from a library with PBC1 value of 0.85. audit_warning: PBC2 (PCR Bottlenecking Coefficient 2, M1/M2) is the ratio of the number of genomic locations where exactly one read maps uniquely (M1) to the number of genomic locations where two reads map uniquely (M2). A PBC2 value in the range 0 - 1 is severe bottlenecking, 1 - 3 is moderate bottlenecking, 3 - 10 is mild bottlenecking, > 10 is no bottlenecking. PBC2 value > 10 is recommended, but > 3 is acceptable. ENCODE processed alignments file {ENCFF444SAY|/files/ENCFF444SAY/} processed by ChIP-seq ENCODE4 v1.6.1 GRCh38 pipeline was generated from a library with PBC2 value of 7.02. audit_warning: PBC1 (PCR Bottlenecking Coefficient 1, M1/M_distinct) is the ratio of the number of genomic locations where exactly one read maps uniquely (M1) to the number of genomic locations where some reads map (M_distinct). A PBC1 value in the range 0 - 0.5 is severe bottlenecking, 0.5 - 0.8 is moderate bottlenecking, 0.8 - 0.9 is mild bottlenecking, and > 0.9 is no bottlenecking. PBC1 value > 0.9 is recommended, but > 0.8 is acceptable. ENCODE processed alignments file {ENCFF313FIN|/files/ENCFF313FIN/} processed by ChIP-seq ENCODE4 v1.6.1 GRCh38 pipeline was generated from a library with PBC1 value of 0.89. audit_warning: PBC2 (PCR Bottlenecking Coefficient 2, M1/M2) is the ratio of the number of genomic locations where exactly one read maps uniquely (M1) to the number of genomic locations where two reads map uniquely (M2). A PBC2 value in the range 0 - 1 is severe bottlenecking, 1 - 3 is moderate bottlenecking, 3 - 10 is mild bottlenecking, > 10 is no bottlenecking. PBC2 value > 10 is recommended, but > 3 is acceptable. ENCODE processed alignments file {ENCFF313FIN|/files/ENCFF313FIN/} processed by ChIP-seq ENCODE4 v1.6.1 GRCh38 pipeline was generated from a library with PBC2 value of 8.67. |
| Labels |
|
Scores (1)
| ID | Type | Default annotation | Description | Histogram | Range | Summary |
|---|---|---|---|---|---|---|
| Histone_ChIP-seq_ENCSR316KHQ | float |
Histone_ChIP-seq_ENCSR316KHQ |
Histone_ChIP-seq ENCSR316KHQ [biosample_summary="Homo sapiens SU-DHL-6" and target="H3K36me3"]
|
 |
[1.49, 10.3] |
|
n counts base pairs; sd is the population standard deviation.
Coverage
| Chromosome | Covered positions | Covered % | Segments |
|---|---|---|---|
| all chromosomes | 58714905 | 1.82% | 81778 |
| chr1 | 5935942 | 2.38% | 8394 |
| chr2 | 5663180 | 2.34% | 7733 |
| chr3 | 4330149 | 2.18% | 6258 |
| chr4 | 1851706 | 0.97% | 2731 |
| chr5 | 3756608 | 2.07% | 5259 |
| chr6 | 3899601 | 2.28% | 5083 |
| chr7 | 3455634 | 2.17% | 4394 |
| chr8 | 2705973 | 1.86% | 3347 |
| chr9 | 2231284 | 1.61% | 3104 |
| chr10 | 2688805 | 2.01% | 3694 |
| chr11 | 2790614 | 2.07% | 3709 |
| chr12 | 3069460 | 2.30% | 4533 |
| chr13 | 1878320 | 1.64% | 2596 |
| chr14 | 2100215 | 1.96% | 3136 |
| chr15 | 2421859 | 2.37% | 3413 |
| chr16 | 1542551 | 1.71% | 2272 |
| chr17 | 2054309 | 2.47% | 3193 |
| chr18 | 1528513 | 1.90% | 1994 |
| chr19 | 2228786 | 3.80% | 2872 |
| chr20 | 1121493 | 1.74% | 1645 |
| chr21 | 591308 | 1.27% | 842 |
| chr22 | 539114 | 1.06% | 865 |
| chrX | 329481 | 0.21% | 711 |
| 3343 contigs with no values (186304500 bp) | 0 | 0.00% | 0 |
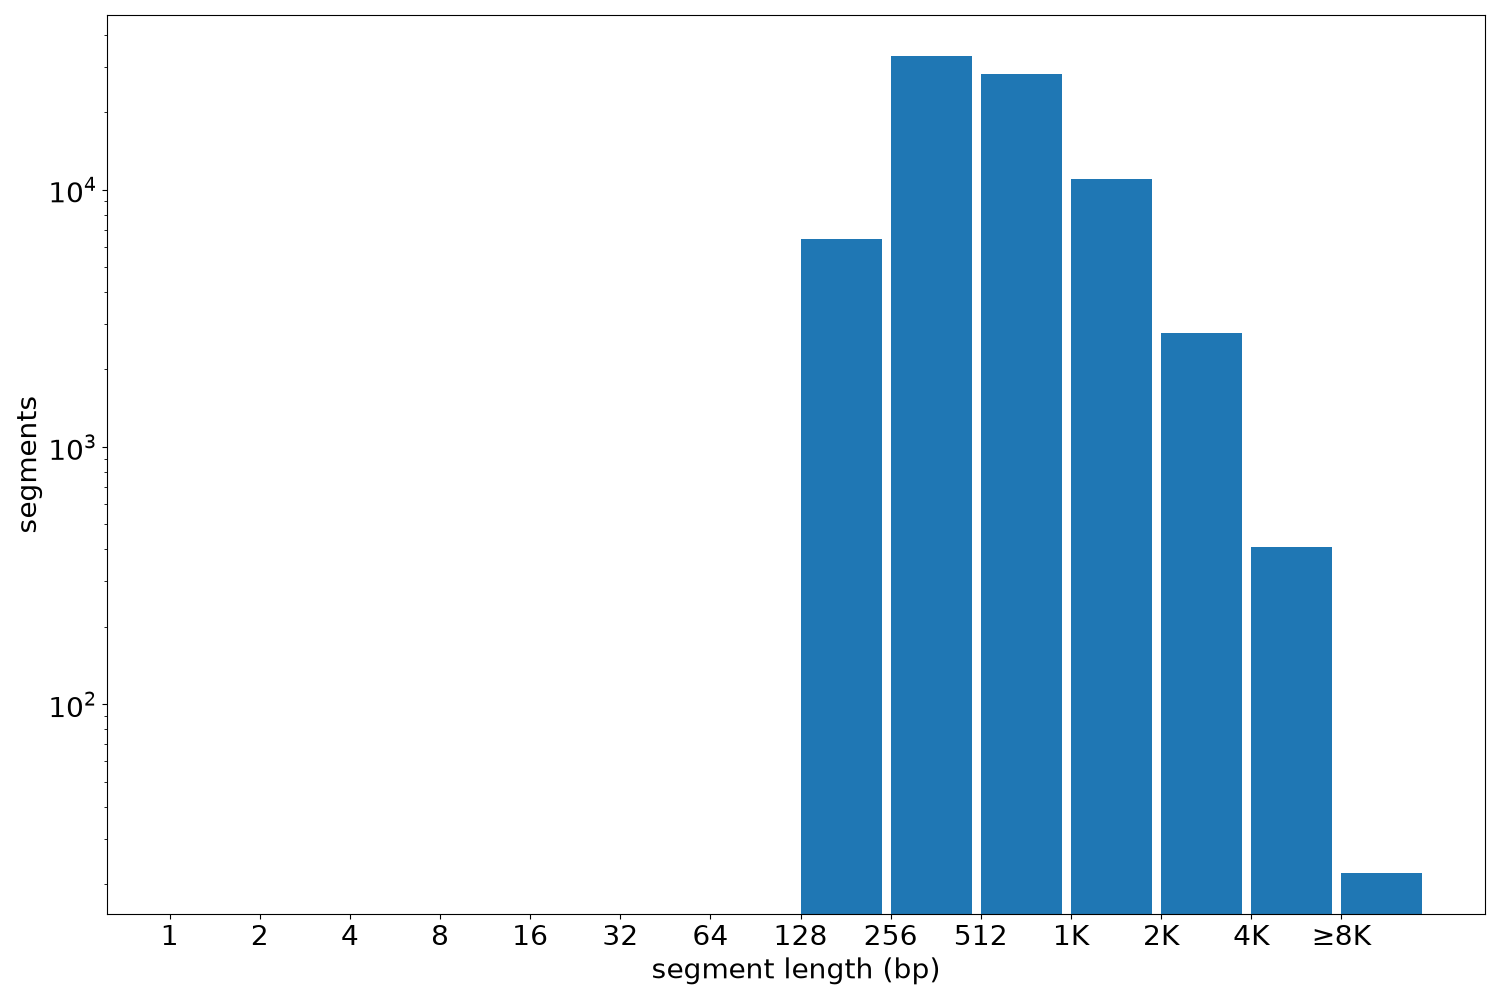
Segment lengths
| segments | min | max | mean | median | |
|---|---|---|---|---|---|
| segments | 81778 | 175 | 15421 | 717.98 | 525 |
Files
| Filename | Size | md5 |
|---|---|---|
| ENCFF923LLZ.bed.gz | 1.8 MB | fa7eba52e4092709366dd369f022f35f |
| ENCFF923LLZ.tabix.bed.gz | 844.79 KB | 3b98d57aa9269d9218d25185ef221bb0 |
| ENCFF923LLZ.tabix.bed.gz.tbi | 147.51 KB | 05f5fe274ce8a8ad95f4165c6f0ec545 |
| genomic_resource.yaml | 4.23 KB | 2b9f4e9ff0b5458265259d2fe12d7310 |
| statistics/ |