Resource
| Id | Histone_ChIP-seq/ENCSR312HLG |
|---|---|
| Type | position_score |
| Version | 0 |
| Summary | Histone_ChIP-seq ENCSR312HLG [biosample_summary="Homo sapiens from a donor with amyotrophic lateral sclerosis; motor neuron" and target="H3K27ac"] |
| Description |
status: released biological_replicates: Rep 1, Rep 2 summary: male child (6 years) with amyotrophic lateral sclerosis output_type: pseudoreplicated peaks audit_internal_action: Released analysis {ENCAN373PXS|/analyses/ENCAN373PXS/} has in progress subobject quality standard {encode4-histone-chip|/quality-standards/encode4-histone-chip/} audit_warning: PBC1 (PCR Bottlenecking Coefficient 1, M1/M_distinct) is the ratio of the number of genomic locations where exactly one read maps uniquely (M1) to the number of genomic locations where some reads map (M_distinct). A PBC1 value in the range 0 - 0.5 is severe bottlenecking, 0.5 - 0.8 is moderate bottlenecking, 0.8 - 0.9 is mild bottlenecking, and > 0.9 is no bottlenecking. PBC1 value > 0.9 is recommended, but > 0.8 is acceptable. ENCODE processed alignments file {ENCFF698JFN|/files/ENCFF698JFN/} processed by ChIP-seq ENCODE4 v1.9.0 GRCh38 pipeline was generated from a library with PBC1 value of 0.80. audit_warning: PBC2 (PCR Bottlenecking Coefficient 2, M1/M2) is the ratio of the number of genomic locations where exactly one read maps uniquely (M1) to the number of genomic locations where two reads map uniquely (M2). A PBC2 value in the range 0 - 1 is severe bottlenecking, 1 - 3 is moderate bottlenecking, 3 - 10 is mild bottlenecking, > 10 is no bottlenecking. PBC2 value > 10 is recommended, but > 3 is acceptable. ENCODE processed alignments file {ENCFF698JFN|/files/ENCFF698JFN/} processed by ChIP-seq ENCODE4 v1.9.0 GRCh38 pipeline was generated from a library with PBC2 value of 4.74. audit_warning: PBC1 (PCR Bottlenecking Coefficient 1, M1/M_distinct) is the ratio of the number of genomic locations where exactly one read maps uniquely (M1) to the number of genomic locations where some reads map (M_distinct). A PBC1 value in the range 0 - 0.5 is severe bottlenecking, 0.5 - 0.8 is moderate bottlenecking, 0.8 - 0.9 is mild bottlenecking, and > 0.9 is no bottlenecking. PBC1 value > 0.9 is recommended, but > 0.8 is acceptable. ENCODE processed alignments file {ENCFF723ZOY|/files/ENCFF723ZOY/} processed by ChIP-seq ENCODE4 v1.9.0 GRCh38 pipeline was generated from a library with PBC1 value of 0.80. audit_warning: PBC2 (PCR Bottlenecking Coefficient 2, M1/M2) is the ratio of the number of genomic locations where exactly one read maps uniquely (M1) to the number of genomic locations where two reads map uniquely (M2). A PBC2 value in the range 0 - 1 is severe bottlenecking, 1 - 3 is moderate bottlenecking, 3 - 10 is mild bottlenecking, > 10 is no bottlenecking. PBC2 value > 10 is recommended, but > 3 is acceptable. ENCODE processed alignments file {ENCFF723ZOY|/files/ENCFF723ZOY/} processed by ChIP-seq ENCODE4 v1.9.0 GRCh38 pipeline was generated from a library with PBC2 value of 4.85. |
| Labels |
|
Scores (1)
| ID | Type | Default annotation | Description | Histogram | Range | Summary |
|---|---|---|---|---|---|---|
| Histone_ChIP-seq_ENCSR312HLG | float |
Histone_ChIP-seq_ENCSR312HLG |
Histone_ChIP-seq ENCSR312HLG [biosample_summary="Homo sapiens from a donor with amyotrophic lateral sclerosis; motor neuron" and target="H3K27ac"]
|
 |
[1.38, 82.8] |
|
n counts base pairs; sd is the population standard deviation.
Coverage
| Chromosome | Covered positions | Covered % | Segments |
|---|---|---|---|
| all chromosomes | 42422325 | 1.32% | 51977 |
| chr1 | 4693196 | 1.89% | 5476 |
| chr2 | 2785790 | 1.15% | 3558 |
| chr3 | 2064347 | 1.04% | 2579 |
| chr4 | 1402968 | 0.74% | 1768 |
| chr5 | 1825887 | 1.01% | 2325 |
| chr6 | 2110158 | 1.24% | 2678 |
| chr7 | 1946298 | 1.22% | 2425 |
| chr8 | 1478026 | 1.02% | 1982 |
| chr9 | 2125758 | 1.54% | 2587 |
| chr10 | 2017809 | 1.51% | 2543 |
| chr11 | 2268382 | 1.68% | 2745 |
| chr12 | 2038459 | 1.53% | 2379 |
| chr13 | 715815 | 0.63% | 992 |
| chr14 | 1243533 | 1.16% | 1497 |
| chr15 | 1419750 | 1.39% | 1733 |
| chr16 | 1890180 | 2.09% | 2284 |
| chr17 | 2691044 | 3.23% | 2986 |
| chr18 | 687485 | 0.86% | 935 |
| chr19 | 2512513 | 4.29% | 2794 |
| chr20 | 1304494 | 2.02% | 1643 |
| chr21 | 452490 | 0.97% | 569 |
| chr22 | 1681546 | 3.31% | 2257 |
| chrX | 1041954 | 0.67% | 1220 |
| chrY | 24443 | 0.04% | 22 |
| 3342 contigs with no values (129077085 bp) | 0 | 0.00% | 0 |
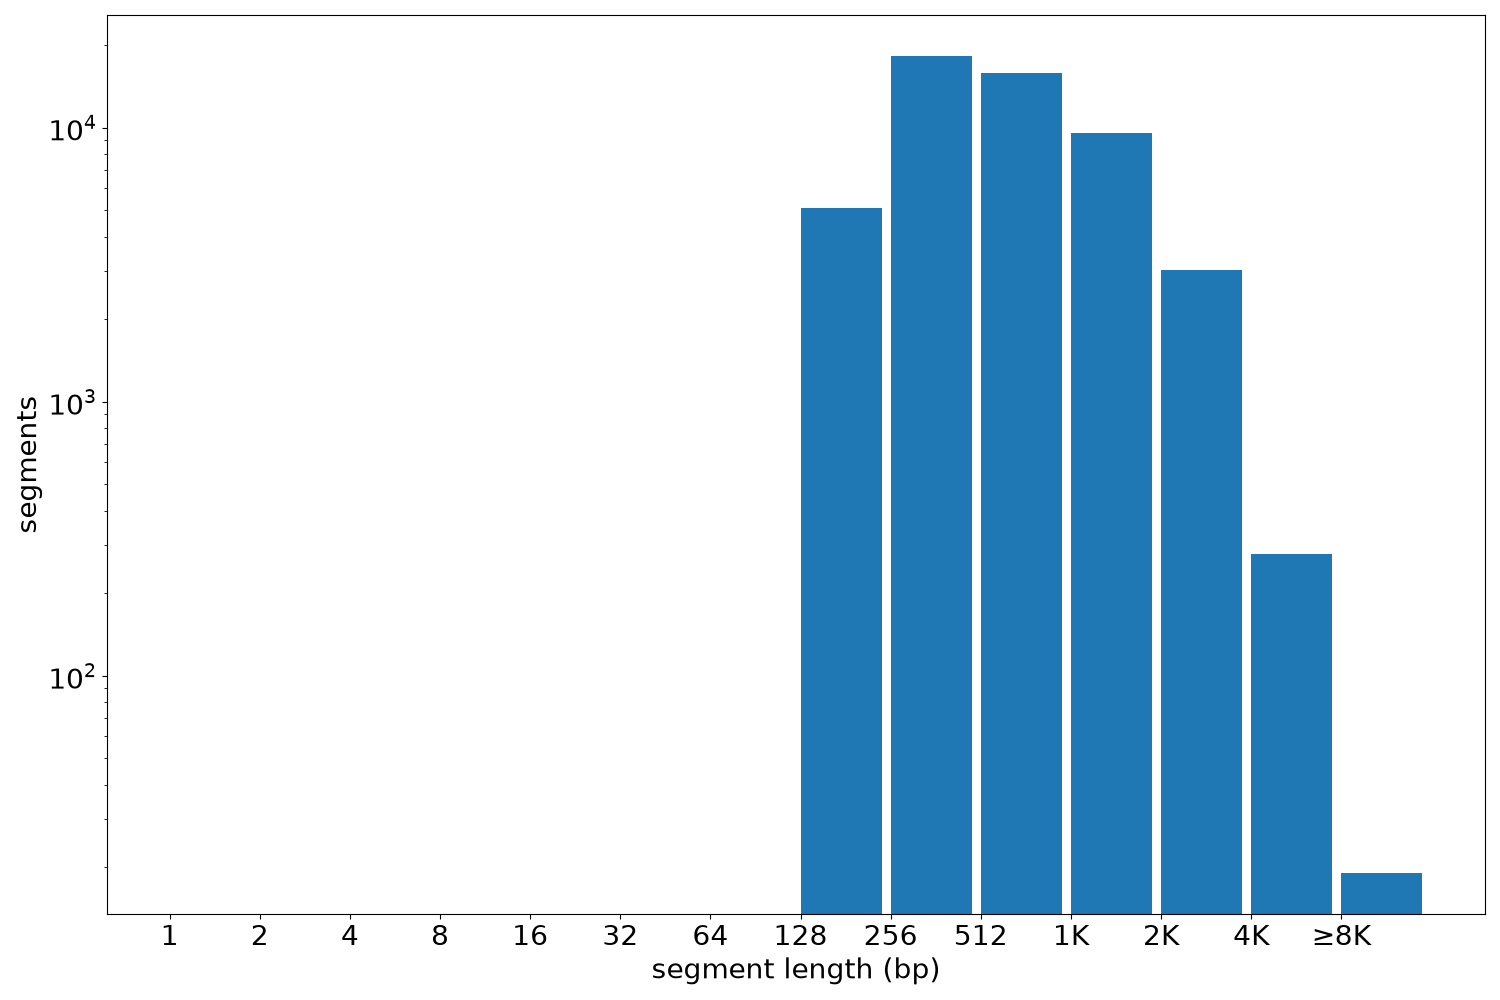
Segment lengths
| segments | min | max | mean | median | |
|---|---|---|---|---|---|
| segments | 51977 | 195 | 20735 | 816.17 | 567 |
Files
| Filename | Size | md5 |
|---|---|---|
| ENCFF817IVB.bed.gz | 1.37 MB | e5a7794f13ffef1aac3917752621dc47 |
| ENCFF817IVB.tabix.bed.gz | 581.28 KB | ca62aadaf4ed49beb58678f2835e89b3 |
| ENCFF817IVB.tabix.bed.gz.tbi | 224.79 KB | aa434c3f82104c35f4caee7d887ed516 |
| genomic_resource.yaml | 4.19 KB | 9ec7c954064ea2d425089bffb75115b7 |
| statistics/ |