Resource
| Id | Histone_ChIP-seq/ENCSR275NCH |
|---|---|
| Type | position_score |
| Version | 0 |
| Summary | Histone_ChIP-seq ENCSR275NCH [biosample_summary="Homo sapiens PC-3" and target="H3K4me3"] |
| Description |
status: released biological_replicates: Rep 1, Rep 2 summary: output_type: replicated peaks audit_internal_action: Archived analysis {ENCAN993XEY|/analyses/ENCAN993XEY/} has in progress subobject quality standard {encode3-histone-chip|/quality-standards/encode3-histone-chip/} audit_warning: PBC1 (PCR Bottlenecking Coefficient 1, M1/M_distinct) is the ratio of the number of genomic locations where exactly one read maps uniquely (M1) to the number of genomic locations where some reads map (M_distinct). A PBC1 value in the range 0 - 0.5 is severe bottlenecking, 0.5 - 0.8 is moderate bottlenecking, 0.8 - 0.9 is mild bottlenecking, and > 0.9 is no bottlenecking. PBC1 value > 0.9 is recommended, but > 0.8 is acceptable. ENCODE processed alignments file {ENCFF899ARW|/files/ENCFF899ARW/} processed by ChIP-seq ENCODE3 hg19 pipeline was generated from a library with PBC1 value of 0.90. |
| Labels |
|
Scores (1)
| ID | Type | Default annotation | Description | Histogram | Range | Summary |
|---|---|---|---|---|---|---|
| Histone_ChIP-seq_ENCSR275NCH | float |
Histone_ChIP-seq_ENCSR275NCH |
Histone_ChIP-seq ENCSR275NCH [biosample_summary="Homo sapiens PC-3" and target="H3K4me3"]
|
 |
[1.52, 48] |
|
n counts base pairs; sd is the population standard deviation.
Coverage
| Chromosome | Covered positions | Covered % | Segments |
|---|---|---|---|
| all chromosomes | 57613152 | 1.79% | 46087 |
| chr1 | 5728574 | 2.30% | 4346 |
| chr2 | 4264689 | 1.76% | 3565 |
| chr3 | 3462355 | 1.75% | 2802 |
| chr4 | 2599336 | 1.37% | 2212 |
| chr5 | 2940681 | 1.62% | 2398 |
| chr6 | 3458890 | 2.03% | 2718 |
| chr7 | 2871041 | 1.80% | 2353 |
| chr8 | 2544715 | 1.75% | 2246 |
| chr9 | 2167733 | 1.57% | 1760 |
| chr10 | 2646699 | 1.98% | 2244 |
| chr11 | 3001583 | 2.22% | 2323 |
| chr12 | 3030782 | 2.27% | 2324 |
| chr13 | 1273951 | 1.11% | 1078 |
| chr14 | 1965811 | 1.84% | 1536 |
| chr15 | 1800471 | 1.77% | 1411 |
| chr16 | 1820970 | 2.02% | 1389 |
| chr17 | 2942152 | 3.53% | 2148 |
| chr18 | 1071141 | 1.33% | 931 |
| chr19 | 2924113 | 4.99% | 2229 |
| chr20 | 1548025 | 2.40% | 1250 |
| chr21 | 700468 | 1.50% | 606 |
| chr22 | 1032183 | 2.03% | 795 |
| chrX | 1815818 | 1.16% | 1421 |
| chrY | 971 | <0.01% | 2 |
| 3342 contigs with no values (129077085 bp) | 0 | 0.00% | 0 |
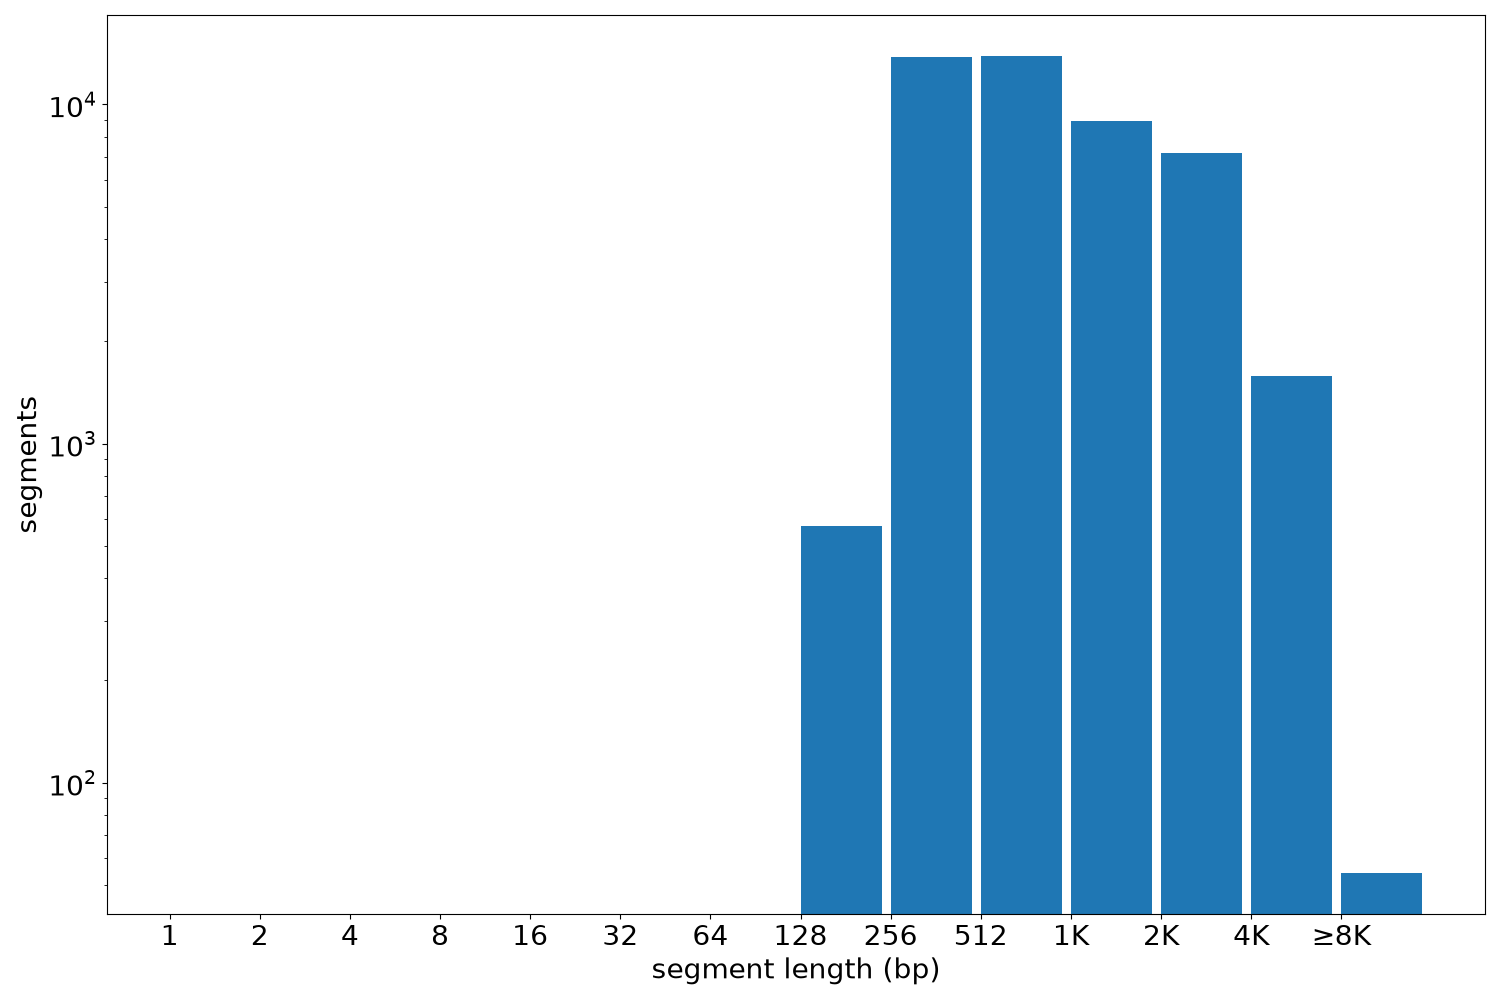
Segment lengths
| segments | min | max | mean | median | |
|---|---|---|---|---|---|
| segments | 46087 | 205 | 22249 | 1250.1 | 759 |
Files
| Filename | Size | md5 |
|---|---|---|
| ENCFF042TQB.bed.gz | 1.25 MB | 5b8c1cbc183a885b40ae475bc84a112b |
| ENCFF042TQB.tabix.bed.gz | 528.27 KB | 3425c7d756624b33ce23d380f303ad44 |
| ENCFF042TQB.tabix.bed.gz.tbi | 229.91 KB | ac0d710d96404825255a5fe65de84f3d |
| genomic_resource.yaml | 2.02 KB | e712546ecb1aac987afc498e3a5bb647 |
| statistics/ |