Resource
| Id | Histone_ChIP-seq/ENCSR224STY |
|---|---|
| Type | position_score |
| Version | 0 |
| Summary | Histone_ChIP-seq ENCSR224STY [biosample_summary="Homo sapiens breast epithelium tissue male adult (37 years)" and target="H3K4me3"] |
| Description |
status: released biological_replicates: Rep 1 summary: male adult (37 years) output_type: pseudoreplicated peaks audit_internal_action: Released analysis {ENCAN107KLL|/analyses/ENCAN107KLL/} has in progress subobject quality standard {encode4-histone-chip|/quality-standards/encode4-histone-chip/} audit_internal_action: Released analysis {ENCAN107KLL|/analyses/ENCAN107KLL/} has in progress subobject document {14f29e4e-2c7d-4a79-8854-05fa19e48fce|/documents/14f29e4e-2c7d-4a79-8854-05fa19e48fce/} audit_warning: PBC1 (PCR Bottlenecking Coefficient 1, M1/M_distinct) is the ratio of the number of genomic locations where exactly one read maps uniquely (M1) to the number of genomic locations where some reads map (M_distinct). A PBC1 value in the range 0 - 0.5 is severe bottlenecking, 0.5 - 0.8 is moderate bottlenecking, 0.8 - 0.9 is mild bottlenecking, and > 0.9 is no bottlenecking. PBC1 value > 0.9 is recommended, but > 0.8 is acceptable. ENCODE processed alignments file {ENCFF345JHQ|/files/ENCFF345JHQ/} processed by ChIP-seq ENCODE4 v1.5.1 GRCh38 pipeline was generated from a library with PBC1 value of 0.89. audit_warning: PBC2 (PCR Bottlenecking Coefficient 2, M1/M2) is the ratio of the number of genomic locations where exactly one read maps uniquely (M1) to the number of genomic locations where two reads map uniquely (M2). A PBC2 value in the range 0 - 1 is severe bottlenecking, 1 - 3 is moderate bottlenecking, 3 - 10 is mild bottlenecking, > 10 is no bottlenecking. PBC2 value > 10 is recommended, but > 3 is acceptable. ENCODE processed alignments file {ENCFF345JHQ|/files/ENCFF345JHQ/} processed by ChIP-seq ENCODE4 v1.5.1 GRCh38 pipeline was generated from a library with PBC2 value of 9.53. |
| Labels |
|
Scores (1)
| ID | Type | Default annotation | Description | Histogram | Range | Summary |
|---|---|---|---|---|---|---|
| Histone_ChIP-seq_ENCSR224STY | float |
Histone_ChIP-seq_ENCSR224STY |
Histone_ChIP-seq ENCSR224STY [biosample_summary="Homo sapiens breast epithelium tissue male adult (37 years)" and target="H3K4me3"]
|
 |
[2.11, 100] |
|
n counts base pairs; sd is the population standard deviation.
Coverage
| Chromosome | Covered positions | Covered % | Segments |
|---|---|---|---|
| all chromosomes | 38508677 | 1.20% | 23511 |
| chr1 | 3835197 | 1.54% | 2337 |
| chr2 | 2599785 | 1.07% | 1536 |
| chr3 | 2181055 | 1.10% | 1291 |
| chr4 | 1551407 | 0.82% | 926 |
| chr5 | 1821475 | 1.00% | 1050 |
| chr6 | 2186769 | 1.28% | 1305 |
| chr7 | 1912682 | 1.20% | 1186 |
| chr8 | 1406249 | 0.97% | 875 |
| chr9 | 1634216 | 1.18% | 1040 |
| chr10 | 1644543 | 1.23% | 998 |
| chr11 | 2087559 | 1.55% | 1209 |
| chr12 | 2097751 | 1.57% | 1220 |
| chr13 | 812735 | 0.71% | 497 |
| chr14 | 1244254 | 1.16% | 744 |
| chr15 | 1238164 | 1.21% | 766 |
| chr16 | 1478033 | 1.64% | 935 |
| chr17 | 2254296 | 2.71% | 1376 |
| chr18 | 661197 | 0.82% | 430 |
| chr19 | 2397926 | 4.09% | 1579 |
| chr20 | 985180 | 1.53% | 606 |
| chr21 | 390481 | 0.84% | 253 |
| chr22 | 863538 | 1.70% | 551 |
| chrX | 1180787 | 0.76% | 773 |
| chrY | 43398 | 0.08% | 28 |
| 3342 contigs with no values (129077085 bp) | 0 | 0.00% | 0 |
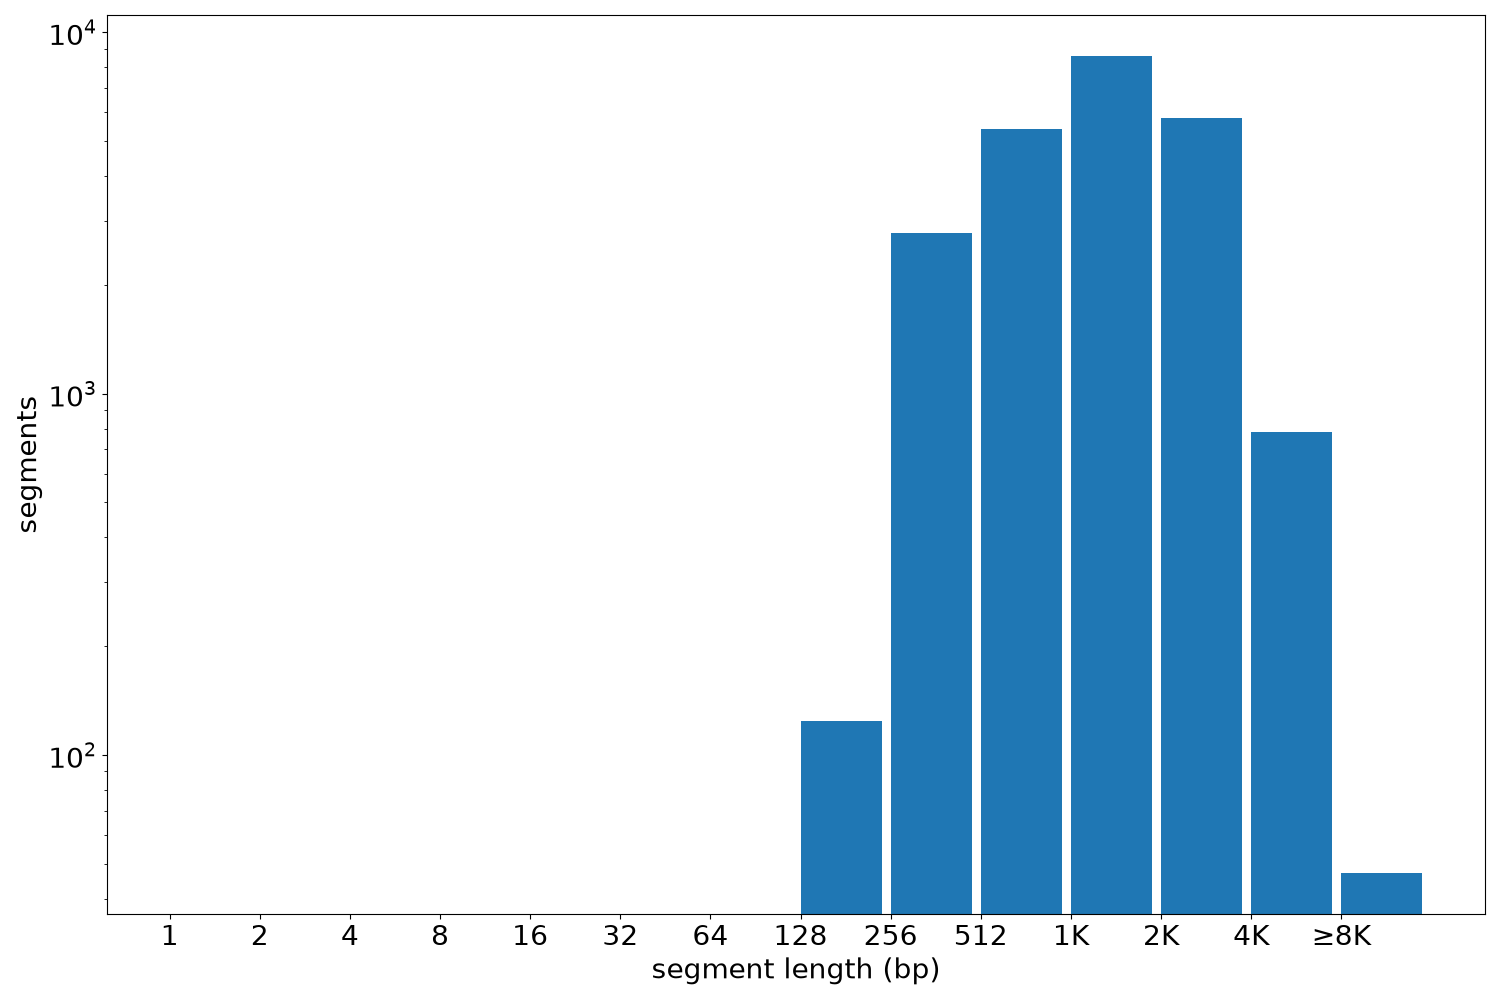
Segment lengths
| segments | min | max | mean | median | |
|---|---|---|---|---|---|
| segments | 23511 | 215 | 17381 | 1637.9 | 1460 |
Files
| Filename | Size | md5 |
|---|---|---|
| ENCFF212SAT.bed.gz | 635.32 KB | bdd3c597b2778a505f5edf71d5f8d16e |
| ENCFF212SAT.tabix.bed.gz | 275.01 KB | 0310d81efc510a58042c4a22107c6a78 |
| ENCFF212SAT.tabix.bed.gz.tbi | 157.59 KB | 949accb9fde39076369affcbaaafcaf8 |
| genomic_resource.yaml | 3.0 KB | 059ba62c0940b3797a241a036ef21e96 |
| statistics/ |