Resource
| Id | Histone_ChIP-seq/ENCSR123JZO |
|---|---|
| Type | position_score |
| Version | 0 |
| Summary | Histone_ChIP-seq ENCSR123JZO [biosample_summary="Homo sapiens neuronal stem cell originated from H1" and target="H2BK15ac"] |
| Description |
status: released biological_replicates: Rep 1, Rep 2 summary: male embryo output_type: pseudoreplicated peaks audit_internal_action: Released analysis {ENCAN852LHX|/analyses/ENCAN852LHX/} has in progress subobject quality standard {encode4-histone-chip|/quality-standards/encode4-histone-chip/} audit_internal_action: Released analysis {ENCAN852LHX|/analyses/ENCAN852LHX/} has in progress subobject document {6fd5104d-3b48-4b2c-b254-9d8e66826b73|/documents/6fd5104d-3b48-4b2c-b254-9d8e66826b73/} audit_warning: PBC1 (PCR Bottlenecking Coefficient 1, M1/M_distinct) is the ratio of the number of genomic locations where exactly one read maps uniquely (M1) to the number of genomic locations where some reads map (M_distinct). A PBC1 value in the range 0 - 0.5 is severe bottlenecking, 0.5 - 0.8 is moderate bottlenecking, 0.8 - 0.9 is mild bottlenecking, and > 0.9 is no bottlenecking. PBC1 value > 0.9 is recommended, but > 0.8 is acceptable. ENCODE processed alignments file {ENCFF359QSN|/files/ENCFF359QSN/} processed by ChIP-seq ENCODE4 v1.6.1 GRCh38 pipeline was generated from a library with PBC1 value of 0.88. audit_warning: PBC2 (PCR Bottlenecking Coefficient 2, M1/M2) is the ratio of the number of genomic locations where exactly one read maps uniquely (M1) to the number of genomic locations where two reads map uniquely (M2). A PBC2 value in the range 0 - 1 is severe bottlenecking, 1 - 3 is moderate bottlenecking, 3 - 10 is mild bottlenecking, > 10 is no bottlenecking. PBC2 value > 10 is recommended, but > 3 is acceptable. ENCODE processed alignments file {ENCFF359QSN|/files/ENCFF359QSN/} processed by ChIP-seq ENCODE4 v1.6.1 GRCh38 pipeline was generated from a library with PBC2 value of 8.34. |
| Labels |
|
Scores (1)
| ID | Type | Default annotation | Description | Histogram | Range | Summary |
|---|---|---|---|---|---|---|
| Histone_ChIP-seq_ENCSR123JZO | float |
Histone_ChIP-seq_ENCSR123JZO |
Histone_ChIP-seq ENCSR123JZO [biosample_summary="Homo sapiens neuronal stem cell originated from H1" and target="H2BK15ac"]
|
 |
[1.6, 9.3] |
|
n counts base pairs; sd is the population standard deviation.
Coverage
| Chromosome | Covered positions | Covered % | Segments |
|---|---|---|---|
| all chromosomes | 33224457 | 1.03% | 62443 |
| chr1 | 3463594 | 1.39% | 6339 |
| chr2 | 2406066 | 0.99% | 4652 |
| chr3 | 1441378 | 0.73% | 2793 |
| chr4 | 975516 | 0.51% | 1846 |
| chr5 | 1220393 | 0.67% | 2451 |
| chr6 | 1387170 | 0.81% | 2718 |
| chr7 | 1554889 | 0.98% | 2936 |
| chr8 | 1269808 | 0.87% | 2425 |
| chr9 | 1817041 | 1.31% | 3246 |
| chr10 | 1585901 | 1.19% | 3137 |
| chr11 | 2366953 | 1.75% | 4158 |
| chr12 | 1263723 | 0.95% | 2475 |
| chr13 | 584215 | 0.51% | 1190 |
| chr14 | 1277040 | 1.19% | 2243 |
| chr15 | 985825 | 0.97% | 1925 |
| chr16 | 1572647 | 1.74% | 2925 |
| chr17 | 2479943 | 2.98% | 4454 |
| chr18 | 456702 | 0.57% | 985 |
| chr19 | 1806011 | 3.08% | 3394 |
| chr20 | 1217410 | 1.89% | 2328 |
| chr21 | 441550 | 0.95% | 858 |
| chr22 | 1545279 | 3.04% | 2683 |
| chrX | 105403 | 0.07% | 282 |
| 3343 contigs with no values (186304500 bp) | 0 | 0.00% | 0 |
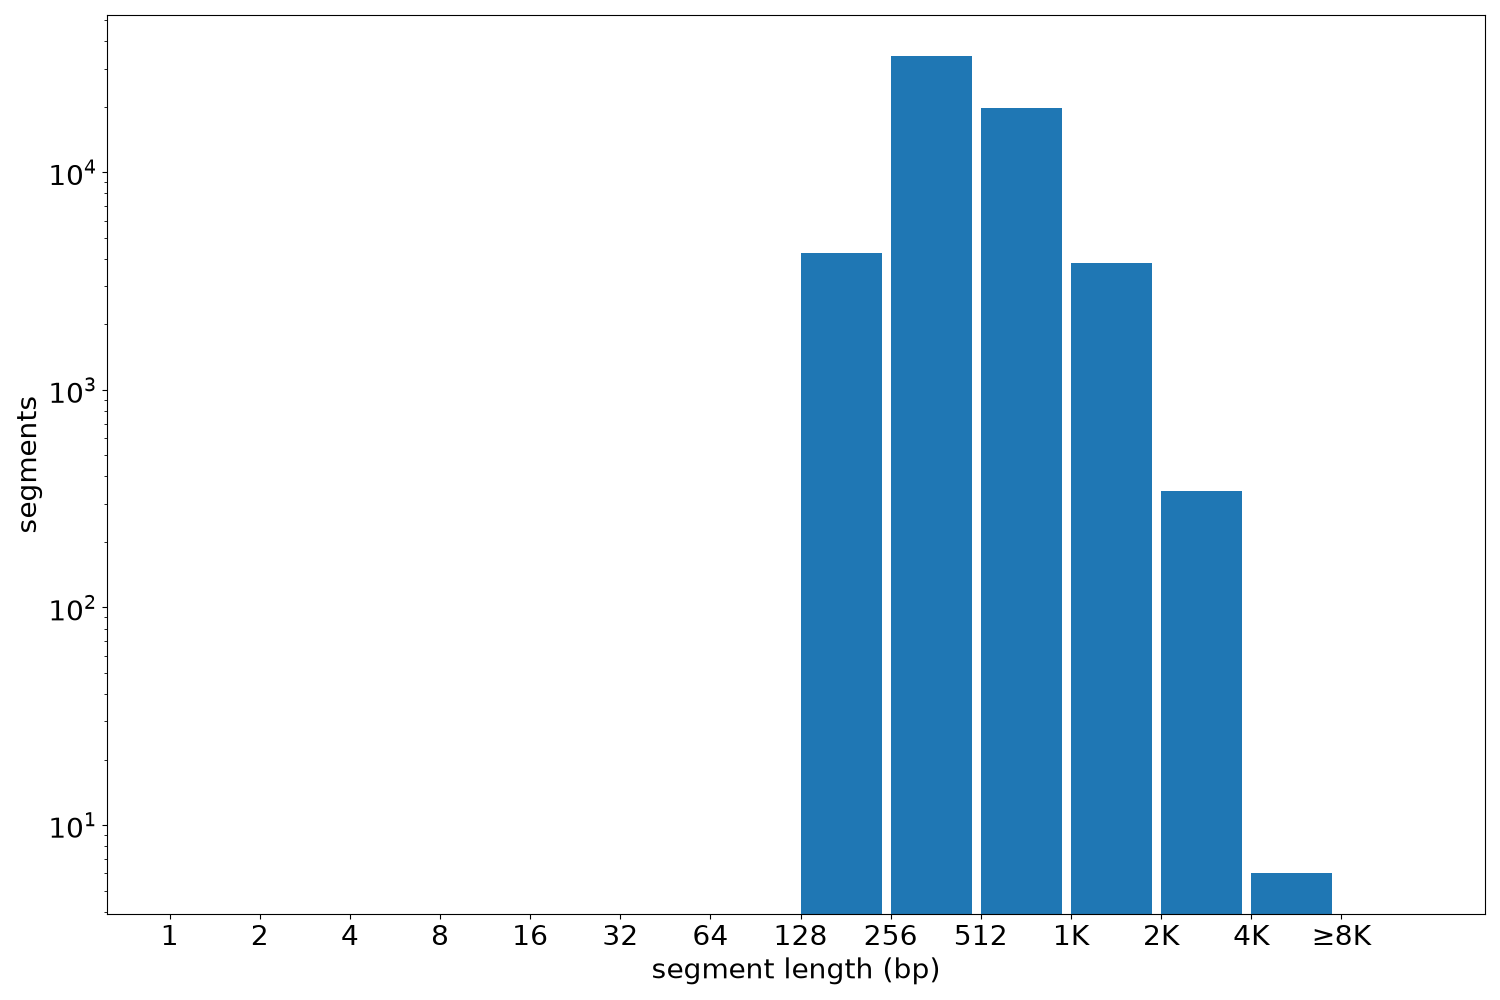
Segment lengths
| segments | min | max | mean | median | |
|---|---|---|---|---|---|
| segments | 62443 | 223 | 6723 | 532.08 | 439 |
Files
| Filename | Size | md5 |
|---|---|---|
| ENCFF704UWK.bed.gz | 1.26 MB | c952993e88e121cd42e524aa57ccbca0 |
| ENCFF704UWK.tabix.bed.gz | 637.8 KB | 73472e0eab28f0420f40fedb81845c4b |
| ENCFF704UWK.tabix.bed.gz.tbi | 206.19 KB | 5a1750979cded2615c08796a5e79bf17 |
| genomic_resource.yaml | 2.97 KB | 9fcbbf44ad34d0346f3c8003133087c9 |
| statistics/ |