Resource
| Id | Histone_ChIP-seq/ENCSR076JBA |
|---|---|
| Type | position_score |
| Version | 0 |
| Summary | Histone_ChIP-seq ENCSR076JBA [biosample_summary="Homo sapiens OCI-LY1" and target="H3K9ac"] |
| Description |
status: released biological_replicates: Rep 1, Rep 2 summary: output_type: pseudoreplicated peaks audit_internal_action: Released analysis {ENCAN100UKM|/analyses/ENCAN100UKM/} has in progress subobject quality standard {encode4-histone-chip|/quality-standards/encode4-histone-chip/} audit_internal_action: Released analysis {ENCAN100UKM|/analyses/ENCAN100UKM/} has in progress subobject document {291c18e7-3ca0-480e-bc0c-2fdc35367e19|/documents/291c18e7-3ca0-480e-bc0c-2fdc35367e19/} audit_warning: PBC1 (PCR Bottlenecking Coefficient 1, M1/M_distinct) is the ratio of the number of genomic locations where exactly one read maps uniquely (M1) to the number of genomic locations where some reads map (M_distinct). A PBC1 value in the range 0 - 0.5 is severe bottlenecking, 0.5 - 0.8 is moderate bottlenecking, 0.8 - 0.9 is mild bottlenecking, and > 0.9 is no bottlenecking. PBC1 value > 0.9 is recommended, but > 0.8 is acceptable. ENCODE processed alignments file {ENCFF092UPO|/files/ENCFF092UPO/} processed by ChIP-seq ENCODE4 v1.6.1 GRCh38 pipeline was generated from a library with PBC1 value of 0.87. audit_warning: PBC2 (PCR Bottlenecking Coefficient 2, M1/M2) is the ratio of the number of genomic locations where exactly one read maps uniquely (M1) to the number of genomic locations where two reads map uniquely (M2). A PBC2 value in the range 0 - 1 is severe bottlenecking, 1 - 3 is moderate bottlenecking, 3 - 10 is mild bottlenecking, > 10 is no bottlenecking. PBC2 value > 10 is recommended, but > 3 is acceptable. ENCODE processed alignments file {ENCFF092UPO|/files/ENCFF092UPO/} processed by ChIP-seq ENCODE4 v1.6.1 GRCh38 pipeline was generated from a library with PBC2 value of 7.63. audit_warning: PBC1 (PCR Bottlenecking Coefficient 1, M1/M_distinct) is the ratio of the number of genomic locations where exactly one read maps uniquely (M1) to the number of genomic locations where some reads map (M_distinct). A PBC1 value in the range 0 - 0.5 is severe bottlenecking, 0.5 - 0.8 is moderate bottlenecking, 0.8 - 0.9 is mild bottlenecking, and > 0.9 is no bottlenecking. PBC1 value > 0.9 is recommended, but > 0.8 is acceptable. ENCODE processed alignments file {ENCFF914MHF|/files/ENCFF914MHF/} processed by ChIP-seq ENCODE4 v1.6.1 GRCh38 pipeline was generated from a library with PBC1 value of 0.82. audit_warning: PBC2 (PCR Bottlenecking Coefficient 2, M1/M2) is the ratio of the number of genomic locations where exactly one read maps uniquely (M1) to the number of genomic locations where two reads map uniquely (M2). A PBC2 value in the range 0 - 1 is severe bottlenecking, 1 - 3 is moderate bottlenecking, 3 - 10 is mild bottlenecking, > 10 is no bottlenecking. PBC2 value > 10 is recommended, but > 3 is acceptable. ENCODE processed alignments file {ENCFF914MHF|/files/ENCFF914MHF/} processed by ChIP-seq ENCODE4 v1.6.1 GRCh38 pipeline was generated from a library with PBC2 value of 5.77. |
| Labels |
|
Scores (1)
| ID | Type | Default annotation | Description | Histogram | Range | Summary |
|---|---|---|---|---|---|---|
| Histone_ChIP-seq_ENCSR076JBA | float |
Histone_ChIP-seq_ENCSR076JBA |
Histone_ChIP-seq ENCSR076JBA [biosample_summary="Homo sapiens OCI-LY1" and target="H3K9ac"]
|
 |
[1.48, 42] |
|
n counts base pairs; sd is the population standard deviation.
Coverage
| Chromosome | Covered positions | Covered % | Segments |
|---|---|---|---|
| all chromosomes | 49001477 | 1.52% | 39930 |
| chr1 | 4483519 | 1.80% | 3687 |
| chr2 | 3709664 | 1.53% | 2974 |
| chr3 | 3038825 | 1.53% | 2444 |
| chr4 | 1892740 | 1.00% | 1504 |
| chr5 | 2382483 | 1.31% | 1893 |
| chr6 | 2727014 | 1.60% | 2126 |
| chr7 | 2459624 | 1.54% | 2096 |
| chr8 | 2007520 | 1.38% | 1638 |
| chr9 | 2056350 | 1.49% | 1661 |
| chr10 | 2022254 | 1.51% | 1651 |
| chr11 | 2351756 | 1.74% | 1783 |
| chr12 | 2601601 | 1.95% | 2058 |
| chr13 | 1086468 | 0.95% | 862 |
| chr14 | 1799045 | 1.68% | 1462 |
| chr15 | 1726994 | 1.69% | 1384 |
| chr16 | 1922729 | 2.13% | 1669 |
| chr17 | 2526838 | 3.03% | 2097 |
| chr18 | 954037 | 1.19% | 749 |
| chr19 | 2436192 | 4.16% | 2201 |
| chr20 | 1414599 | 2.20% | 1181 |
| chr21 | 509186 | 1.09% | 436 |
| chr22 | 1366262 | 2.69% | 1131 |
| chrX | 1431984 | 0.92% | 1170 |
| chrY | 93793 | 0.16% | 73 |
| 3342 contigs with no values (129077085 bp) | 0 | 0.00% | 0 |
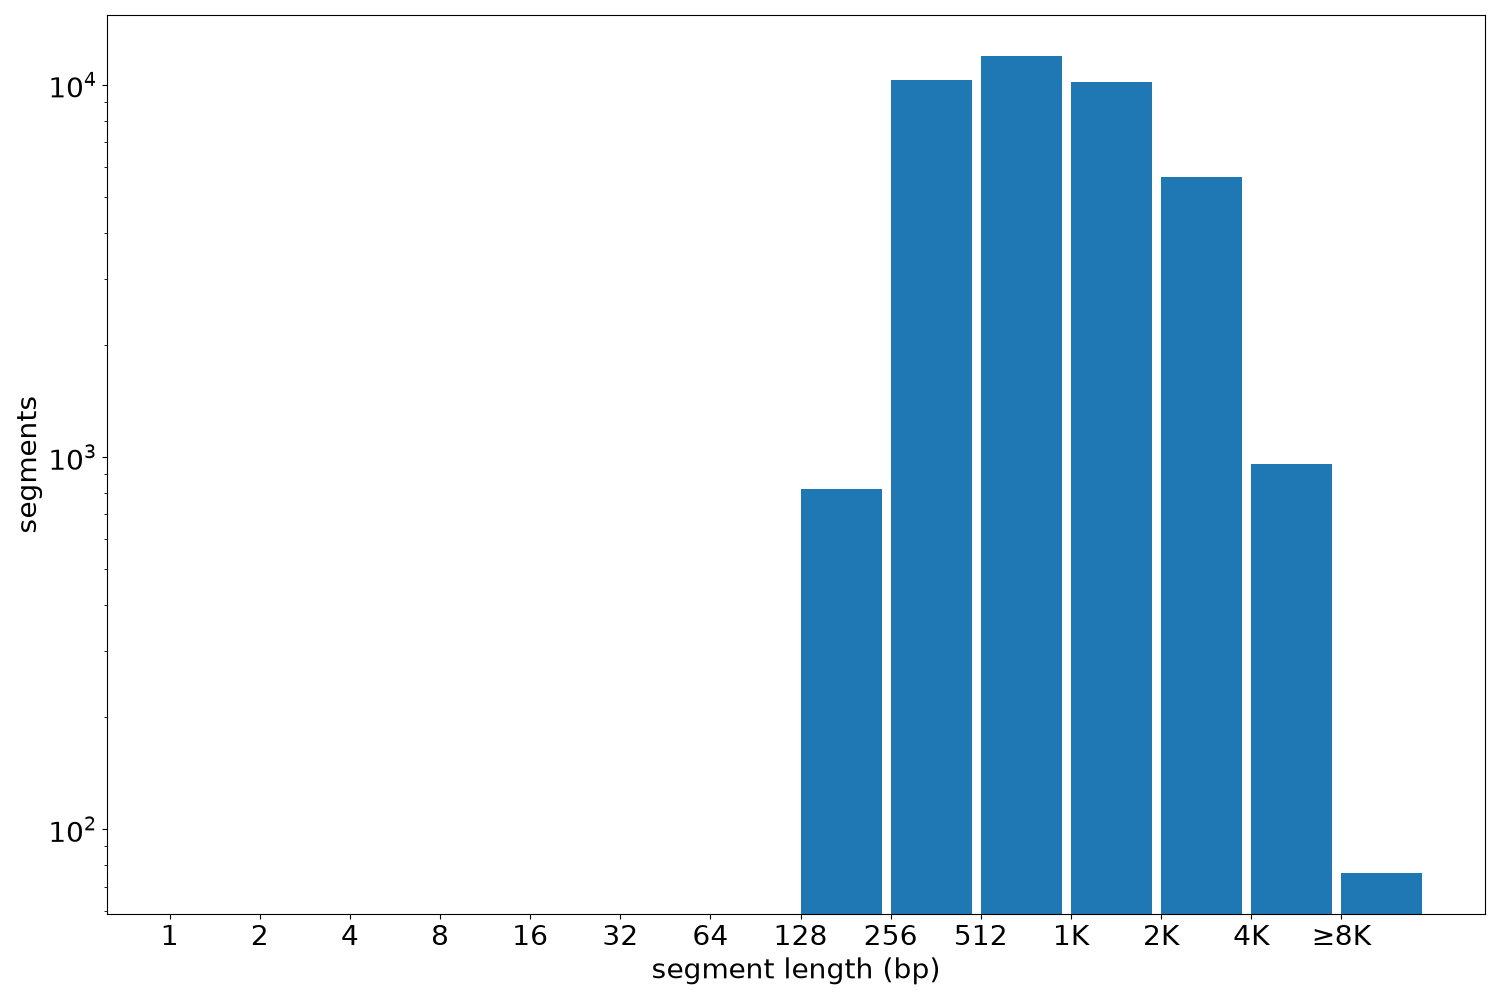
Segment lengths
| segments | min | max | mean | median | |
|---|---|---|---|---|---|
| segments | 39930 | 218 | 18461 | 1227.18 | 844 |
Files
| Filename | Size | md5 |
|---|---|---|
| ENCFF233RHV.bed.gz | 1.07 MB | a5478d5b743cb64f40d0c0f889480f76 |
| ENCFF233RHV.tabix.bed.gz | 455.57 KB | 9c5bd7fcac520bb5c03520e9487b615c |
| ENCFF233RHV.tabix.bed.gz.tbi | 147.35 KB | 0ced91e2ef7934080e443e098fdd31e5 |
| genomic_resource.yaml | 4.22 KB | 4f7c8abe95c94c5ed3c838d0d662526d |
| statistics/ |