Resource
| Id | Histone_ChIP-seq/ENCSR045HLL |
|---|---|
| Type | position_score |
| Version | 0 |
| Summary | Histone_ChIP-seq ENCSR045HLL [biosample_summary="Homo sapiens neural cell originated from H1" and target="H3K4me2"] |
| Description |
status: released biological_replicates: Rep 1, Rep 2 summary: male embryo output_type: replicated peaks audit_internal_action: Archived analysis {ENCAN145XCI|/analyses/ENCAN145XCI/} has in progress subobject quality standard {encode3-histone-chip|/quality-standards/encode3-histone-chip/} audit_warning: PBC1 (PCR Bottlenecking Coefficient 1, M1/M_distinct) is the ratio of the number of genomic locations where exactly one read maps uniquely (M1) to the number of genomic locations where some reads map (M_distinct). A PBC1 value in the range 0 - 0.5 is severe bottlenecking, 0.5 - 0.8 is moderate bottlenecking, 0.8 - 0.9 is mild bottlenecking, and > 0.9 is no bottlenecking. PBC1 value > 0.9 is recommended, but > 0.8 is acceptable. ENCODE processed alignments file {ENCFF454FGI|/files/ENCFF454FGI/} processed by ChIP-seq ENCODE3 GRCh38 pipeline was generated from a library with PBC1 value of 0.87. audit_warning: PBC2 (PCR Bottlenecking Coefficient 2, M1/M2) is the ratio of the number of genomic locations where exactly one read maps uniquely (M1) to the number of genomic locations where two reads map uniquely (M2). A PBC2 value in the range 0 - 1 is severe bottlenecking, 1 - 3 is moderate bottlenecking, 3 - 10 is mild bottlenecking, > 10 is no bottlenecking. PBC2 value > 10 is recommended, but > 3 is acceptable. ENCODE processed alignments file {ENCFF454FGI|/files/ENCFF454FGI/} processed by ChIP-seq ENCODE3 GRCh38 pipeline was generated from a library with PBC2 value of 7.61. |
| Labels |
|
Scores (1)
| ID | Type | Default annotation | Description | Histogram | Range | Summary |
|---|---|---|---|---|---|---|
| Histone_ChIP-seq_ENCSR045HLL | float |
Histone_ChIP-seq_ENCSR045HLL |
Histone_ChIP-seq ENCSR045HLL [biosample_summary="Homo sapiens neural cell originated from H1" and target="H3K4me2"]
|
 |
[1.62, 10.6] |
|
n counts base pairs; sd is the population standard deviation.
Coverage
| Chromosome | Covered positions | Covered % | Segments |
|---|---|---|---|
| all chromosomes | 36477600 | 1.13% | 43312 |
| chr1 | 3432666 | 1.38% | 3949 |
| chr1_KI270713v1_random | 206 | 0.51% | 1 |
| chr2 | 2883945 | 1.19% | 3416 |
| chr3 | 2307951 | 1.16% | 2781 |
| chr4 | 1844365 | 0.97% | 2236 |
| chr5 | 2226474 | 1.23% | 2503 |
| chr6 | 2335238 | 1.37% | 2692 |
| chr7 | 1885707 | 1.18% | 2236 |
| chr8 | 1698078 | 1.17% | 2005 |
| chr9 | 1434752 | 1.04% | 1694 |
| chr10 | 1597345 | 1.19% | 1931 |
| chr11 | 1948723 | 1.44% | 2301 |
| chr12 | 1954616 | 1.47% | 2246 |
| chr13 | 1008746 | 0.88% | 1258 |
| chr14 | 1353897 | 1.26% | 1491 |
| chr15 | 1143622 | 1.12% | 1337 |
| chr16 | 1174417 | 1.30% | 1448 |
| chr17 | 1586220 | 1.91% | 1897 |
| chr18 | 739734 | 0.92% | 948 |
| chr19 | 1432463 | 2.44% | 1823 |
| chr20 | 865581 | 1.34% | 1046 |
| chr21 | 320777 | 0.69% | 395 |
| chr22 | 620451 | 1.22% | 738 |
| chrUn_KI270466v1 | 519 | 42.09% | 1 |
| chrUn_KI270467v1 | 1581 | 40.33% | 1 |
| chrX | 657481 | 0.42% | 907 |
| chrY | 22045 | 0.04% | 31 |
| 3339 contigs with no values (129031187 bp) | 0 | 0.00% | 0 |
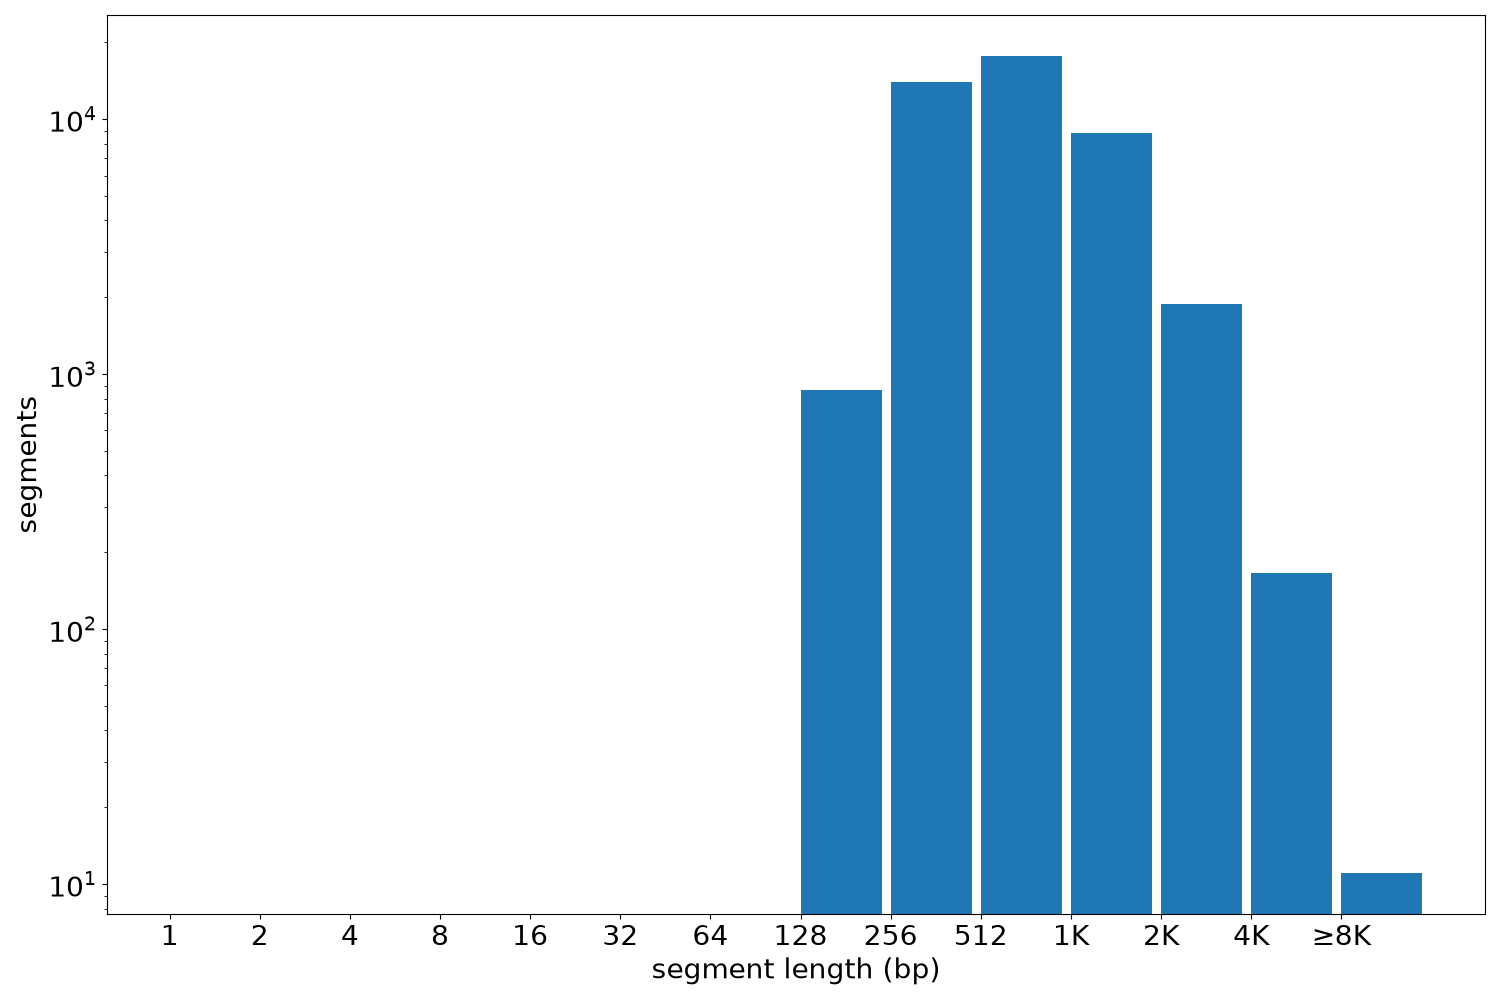
Segment lengths
| segments | min | max | mean | median | |
|---|---|---|---|---|---|
| segments | 43312 | 195 | 11662 | 842.21 | 658 |
Files
| Filename | Size | md5 |
|---|---|---|
| ENCFF748NZC.bed.gz | 1.03 MB | a3acfe1ee16446899ed31cd2a47ace81 |
| ENCFF748NZC.tabix.bed.gz | 470.43 KB | d10ff7e1e99097e9a01f8358f5952f19 |
| ENCFF748NZC.tabix.bed.gz.tbi | 210.22 KB | 96c892abe1d0244fd6d9ad90ae37a8b7 |
| genomic_resource.yaml | 2.84 KB | 19af9112572222e2a08033863cf56aaf |
| statistics/ |