Resource
| Id | Histone_ChIP-seq/ENCSR038OIN |
|---|---|
| Type | position_score |
| Version | 0 |
| Summary | Histone_ChIP-seq ENCSR038OIN [biosample_summary="Homo sapiens trophoblast cell originated from H1" and target="H3K36me3"] |
| Description |
status: released biological_replicates: Rep 1, Rep 2 summary: male embryo output_type: pseudoreplicated peaks audit_internal_action: Released analysis {ENCAN757SFL|/analyses/ENCAN757SFL/} has in progress subobject quality standard {encode4-histone-chip|/quality-standards/encode4-histone-chip/} audit_internal_action: Released analysis {ENCAN757SFL|/analyses/ENCAN757SFL/} has in progress subobject document {e284c0e6-2a5c-407b-91f1-24c5961de8db|/documents/e284c0e6-2a5c-407b-91f1-24c5961de8db/} audit_not_compliant: Processed alignments file {ENCFF096SAK|/files/ENCFF096SAK/} processed by ChIP-seq ENCODE4 v1.6.1 GRCh38 pipeline has 30672994 usable fragments. The minimum ENCODE standard for each replicate in a ChIP-seq experiment targeting H3K36me3-human and investigated as a broad histone mark is 20 million usable fragments. The recommended value is > 45 million, but > 35 million is acceptable. (See {ENCODE ChIP-seq data standards|/data-standards/chip-seq/}) audit_not_compliant: Processed alignments file {ENCFF234RNO|/files/ENCFF234RNO/} processed by ChIP-seq ENCODE4 v1.6.1 GRCh38 pipeline has 21843093 usable fragments. The minimum ENCODE standard for each replicate in a ChIP-seq experiment targeting H3K36me3-human and investigated as a broad histone mark is 20 million usable fragments. The recommended value is > 45 million, but > 35 million is acceptable. (See {ENCODE ChIP-seq data standards|/data-standards/chip-seq/}) audit_warning: PBC1 (PCR Bottlenecking Coefficient 1, M1/M_distinct) is the ratio of the number of genomic locations where exactly one read maps uniquely (M1) to the number of genomic locations where some reads map (M_distinct). A PBC1 value in the range 0 - 0.5 is severe bottlenecking, 0.5 - 0.8 is moderate bottlenecking, 0.8 - 0.9 is mild bottlenecking, and > 0.9 is no bottlenecking. PBC1 value > 0.9 is recommended, but > 0.8 is acceptable. ENCODE processed alignments file {ENCFF096SAK|/files/ENCFF096SAK/} processed by ChIP-seq ENCODE4 v1.6.1 GRCh38 pipeline was generated from a library with PBC1 value of 0.90. audit_warning: PBC2 (PCR Bottlenecking Coefficient 2, M1/M2) is the ratio of the number of genomic locations where exactly one read maps uniquely (M1) to the number of genomic locations where two reads map uniquely (M2). A PBC2 value in the range 0 - 1 is severe bottlenecking, 1 - 3 is moderate bottlenecking, 3 - 10 is mild bottlenecking, > 10 is no bottlenecking. PBC2 value > 10 is recommended, but > 3 is acceptable. ENCODE processed alignments file {ENCFF096SAK|/files/ENCFF096SAK/} processed by ChIP-seq ENCODE4 v1.6.1 GRCh38 pipeline was generated from a library with PBC2 value of 9.61. audit_warning: PBC1 (PCR Bottlenecking Coefficient 1, M1/M_distinct) is the ratio of the number of genomic locations where exactly one read maps uniquely (M1) to the number of genomic locations where some reads map (M_distinct). A PBC1 value in the range 0 - 0.5 is severe bottlenecking, 0.5 - 0.8 is moderate bottlenecking, 0.8 - 0.9 is mild bottlenecking, and > 0.9 is no bottlenecking. PBC1 value > 0.9 is recommended, but > 0.8 is acceptable. ENCODE processed alignments file {ENCFF234RNO|/files/ENCFF234RNO/} processed by ChIP-seq ENCODE4 v1.6.1 GRCh38 pipeline was generated from a library with PBC1 value of 0.84. audit_warning: PBC2 (PCR Bottlenecking Coefficient 2, M1/M2) is the ratio of the number of genomic locations where exactly one read maps uniquely (M1) to the number of genomic locations where two reads map uniquely (M2). A PBC2 value in the range 0 - 1 is severe bottlenecking, 1 - 3 is moderate bottlenecking, 3 - 10 is mild bottlenecking, > 10 is no bottlenecking. PBC2 value > 10 is recommended, but > 3 is acceptable. ENCODE processed alignments file {ENCFF234RNO|/files/ENCFF234RNO/} processed by ChIP-seq ENCODE4 v1.6.1 GRCh38 pipeline was generated from a library with PBC2 value of 6.72. |
| Labels |
|
Scores (1)
| ID | Type | Default annotation | Description | Histogram | Range | Summary |
|---|---|---|---|---|---|---|
| Histone_ChIP-seq_ENCSR038OIN | float |
Histone_ChIP-seq_ENCSR038OIN |
Histone_ChIP-seq ENCSR038OIN [biosample_summary="Homo sapiens trophoblast cell originated from H1" and target="H3K36me3"]
|
 |
[1.67, 40] |
|
n counts base pairs; sd is the population standard deviation.
Coverage
| Chromosome | Covered positions | Covered % | Segments |
|---|---|---|---|
| all chromosomes | 78758890 | 2.45% | 163892 |
| chr1 | 7771164 | 3.12% | 16268 |
| chr2 | 4730464 | 1.95% | 11704 |
| chr3 | 4098936 | 2.07% | 9382 |
| chr4 | 2625124 | 1.38% | 6547 |
| chr5 | 3719206 | 2.05% | 8575 |
| chr6 | 2968088 | 1.74% | 6948 |
| chr7 | 3857241 | 2.42% | 8184 |
| chr8 | 2465157 | 1.70% | 5793 |
| chr9 | 3725171 | 2.69% | 7256 |
| chr10 | 3234332 | 2.42% | 7478 |
| chr11 | 4187851 | 3.10% | 8006 |
| chr12 | 4234859 | 3.18% | 8623 |
| chr13 | 1445389 | 1.26% | 3759 |
| chr14 | 2389589 | 2.23% | 5412 |
| chr15 | 2548029 | 2.50% | 5800 |
| chr16 | 4277942 | 4.74% | 7364 |
| chr17 | 5138570 | 6.17% | 9613 |
| chr18 | 1134821 | 1.41% | 3053 |
| chr19 | 6252148 | 10.67% | 9323 |
| chr20 | 2727887 | 4.23% | 5008 |
| chr21 | 1023400 | 2.19% | 2061 |
| chr22 | 2645800 | 5.21% | 4154 |
| chrX | 1481894 | 0.95% | 3367 |
| chrY | 75828 | 0.13% | 214 |
| 3342 contigs with no values (129077085 bp) | 0 | 0.00% | 0 |
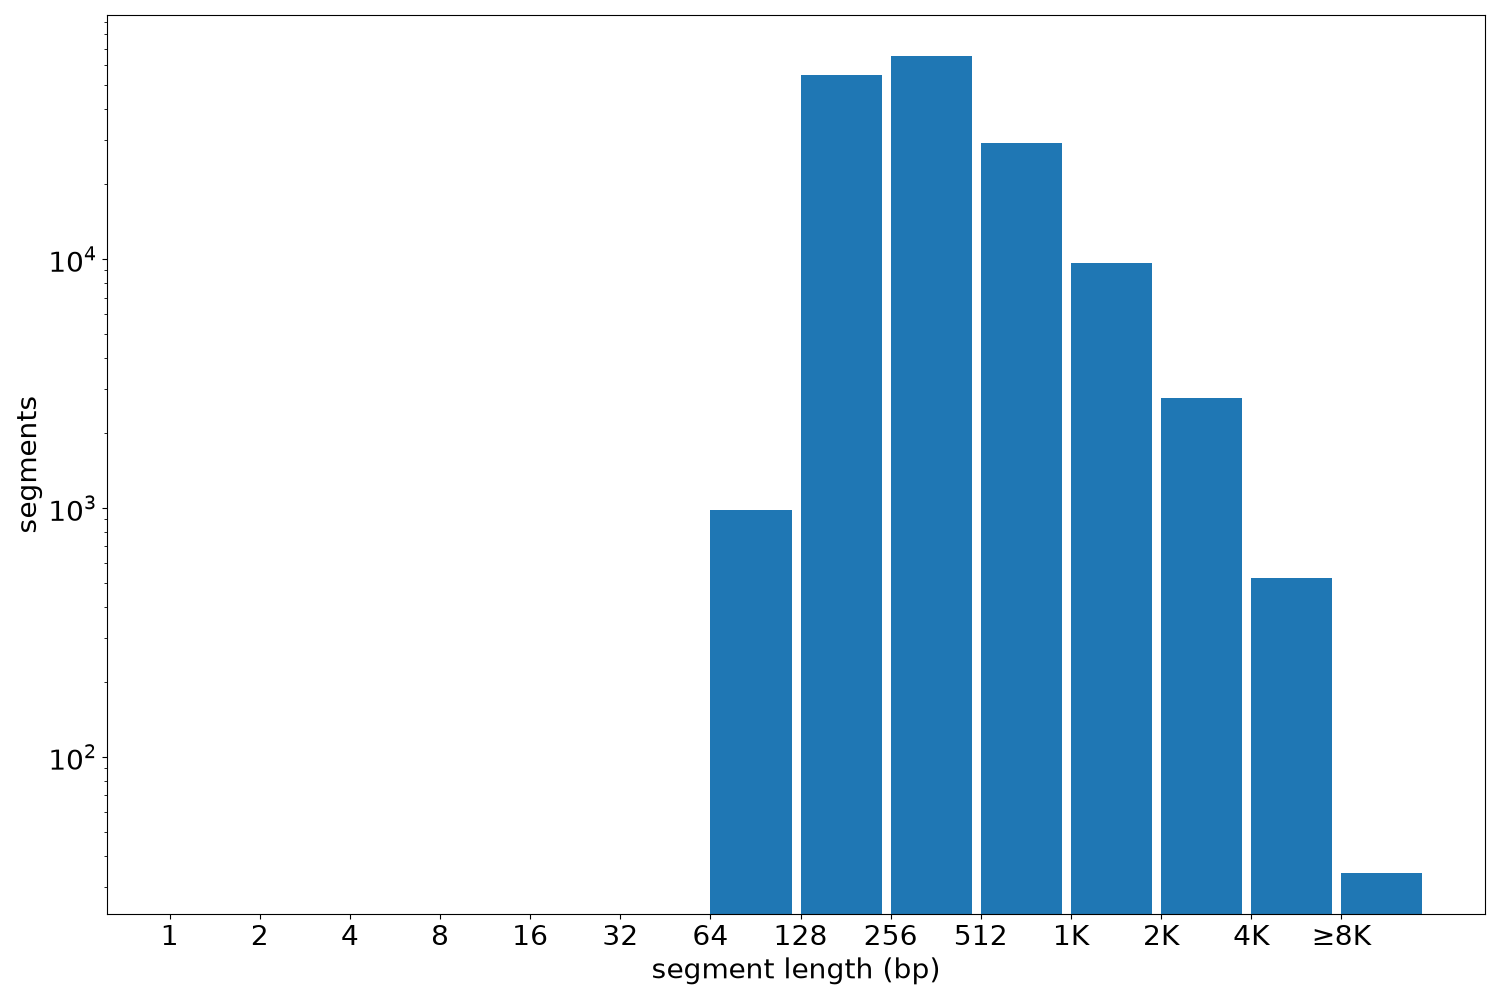
Segment lengths
| segments | min | max | mean | median | |
|---|---|---|---|---|---|
| segments | 163892 | 120 | 23259 | 480.55 | 324 |
Files
| Filename | Size | md5 |
|---|---|---|
| ENCFF009GYO.bed.gz | 3.53 MB | 4b817885f238f7be90d0798bba06a556 |
| ENCFF009GYO.tabix.bed.gz | 1.6 MB | e72b56b07bcd769a2ee33a9e55704d0c |
| ENCFF009GYO.tabix.bed.gz.tbi | 205.78 KB | 1d6157540a57baa4bfdd0cc6469c029f |
| genomic_resource.yaml | 5.22 KB | 6471415aae9393a4a41cbb765548461a |
| statistics/ |