Resource
| Id | Histone_ChIP-seq/ENCSR000FCL |
|---|---|
| Type | position_score |
| Version | 0 |
| Summary | Histone_ChIP-seq ENCSR000FCL [biosample_summary="Homo sapiens GM08714" and target="H3K4me3"] |
| Description |
status: released biological_replicates: Rep 1, Rep 2 summary: output_type: replicated peaks audit_internal_action: Archived analysis {ENCAN736YSU|/analyses/ENCAN736YSU/} has in progress subobject quality standard {encode3-histone-chip|/quality-standards/encode3-histone-chip/} audit_warning: PBC1 (PCR Bottlenecking Coefficient 1, M1/M_distinct) is the ratio of the number of genomic locations where exactly one read maps uniquely (M1) to the number of genomic locations where some reads map (M_distinct). A PBC1 value in the range 0 - 0.5 is severe bottlenecking, 0.5 - 0.8 is moderate bottlenecking, 0.8 - 0.9 is mild bottlenecking, and > 0.9 is no bottlenecking. PBC1 value > 0.9 is recommended, but > 0.8 is acceptable. ENCODE processed alignments file {ENCFF494CGD|/files/ENCFF494CGD/} processed by ChIP-seq ENCODE3 GRCh38 pipeline was generated from a library with PBC1 value of 0.82. audit_warning: PBC2 (PCR Bottlenecking Coefficient 2, M1/M2) is the ratio of the number of genomic locations where exactly one read maps uniquely (M1) to the number of genomic locations where two reads map uniquely (M2). A PBC2 value in the range 0 - 1 is severe bottlenecking, 1 - 3 is moderate bottlenecking, 3 - 10 is mild bottlenecking, > 10 is no bottlenecking. PBC2 value > 10 is recommended, but > 3 is acceptable. ENCODE processed alignments file {ENCFF494CGD|/files/ENCFF494CGD/} processed by ChIP-seq ENCODE3 GRCh38 pipeline was generated from a library with PBC2 value of 6.30. |
| Labels |
|
Scores (1)
| ID | Type | Default annotation | Description | Histogram | Range | Summary |
|---|---|---|---|---|---|---|
| Histone_ChIP-seq_ENCSR000FCL | float |
Histone_ChIP-seq_ENCSR000FCL |
Histone_ChIP-seq ENCSR000FCL [biosample_summary="Homo sapiens GM08714" and target="H3K4me3"]
|
 |
[1.55, 53] |
|
n counts base pairs; sd is the population standard deviation.
Coverage
| Chromosome | Covered positions | Covered % | Segments |
|---|---|---|---|
| all chromosomes | 37018859 | 1.15% | 37529 |
| chr1 | 3656890 | 1.47% | 3615 |
| chr2 | 2605538 | 1.08% | 2720 |
| chr3 | 2061176 | 1.04% | 2103 |
| chr4 | 1503605 | 0.79% | 1536 |
| chr5 | 1891161 | 1.04% | 1812 |
| chr6 | 2537447 | 1.49% | 2545 |
| chr7 | 1782672 | 1.12% | 1843 |
| chr8 | 1418747 | 0.98% | 1486 |
| chr9 | 1428088 | 1.03% | 1467 |
| chr10 | 1567409 | 1.17% | 1637 |
| chr11 | 1809104 | 1.34% | 1773 |
| chr12 | 2027618 | 1.52% | 2005 |
| chr13 | 803882 | 0.70% | 860 |
| chr14 | 1294684 | 1.21% | 1333 |
| chr14_GL000194v1_random | 325 | 0.17% | 1 |
| chr14_KI270726v1_random | 310 | 0.71% | 1 |
| chr15 | 1235130 | 1.21% | 1262 |
| chr16 | 1375320 | 1.52% | 1387 |
| chr17 | 2058147 | 2.47% | 2006 |
| chr17_GL000205v2_random | 3184 | 1.72% | 4 |
| chr18 | 682248 | 0.85% | 746 |
| chr19 | 2116020 | 3.61% | 2056 |
| chr20 | 889193 | 1.38% | 926 |
| chr21 | 361201 | 0.77% | 372 |
| chr22 | 763148 | 1.50% | 774 |
| chrEBV | 11356 | 6.61% | 8 |
| chrUn_GL000219v1 | 2220 | 1.24% | 3 |
| chrX | 1133036 | 0.73% | 1248 |
| 3338 contigs with no values (185532680 bp) | 0 | 0.00% | 0 |
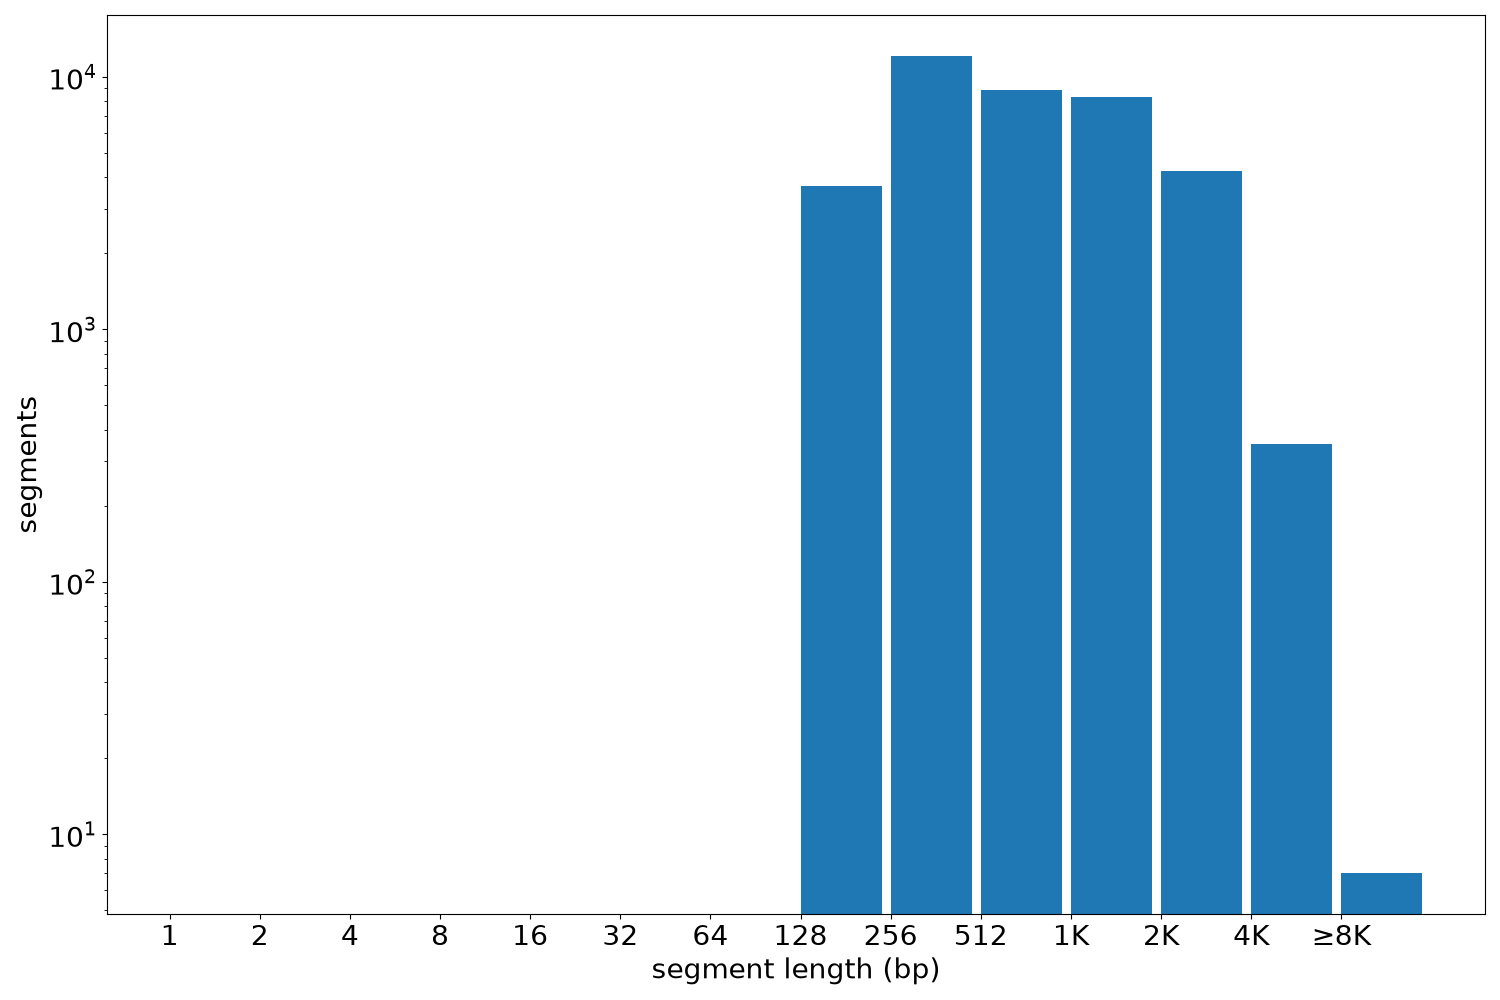
Segment lengths
| segments | min | max | mean | median | |
|---|---|---|---|---|---|
| segments | 37529 | 185 | 10688 | 986.41 | 625 |
Files
| Filename | Size | md5 |
|---|---|---|
| ENCFF590XUH.bed.gz | 1020.76 KB | cdeeafe9862608781795c1ddcbac81cf |
| ENCFF590XUH.tabix.bed.gz | 426.33 KB | f90e02cb2e87758137e49edbfd9c593e |
| ENCFF590XUH.tabix.bed.gz.tbi | 165.34 KB | 6e87e84169b563882b3bdfe20c8ef0a6 |
| genomic_resource.yaml | 2.67 KB | f80c3ca943405536a796e13c20b0ee71 |
| statistics/ |