Resource
| Id | Histone_ChIP-seq/ENCSR000DVC |
|---|---|
| Type | position_score |
| Version | 0 |
| Summary | Histone_ChIP-seq ENCSR000DVC [biosample_summary="Homo sapiens fibroblast of lung" and target="H3K4me3"] |
| Description |
status: released biological_replicates: Rep 1, Rep 2 summary: output_type: replicated peaks audit_internal_action: Archived analysis {ENCAN629ICR|/analyses/ENCAN629ICR/} has in progress subobject quality standard {encode3-histone-chip|/quality-standards/encode3-histone-chip/} audit_warning: Processed alignments file {ENCFF426CQE|/files/ENCFF426CQE/} processed by ChIP-seq ENCODE3 hg19 pipeline has 14634910 usable fragments. The minimum ENCODE standard for each replicate in a ChIP-seq experiment targeting H3K4me3-human and investigated as a narrow histone mark is 10 million usable fragments. The recommended value is > 20 million, but > 10 million is acceptable. (See {ENCODE ChIP-seq data standards|/data-standards/chip-seq/}) audit_warning: Processed alignments file {ENCFF440CVG|/files/ENCFF440CVG/} processed by ChIP-seq ENCODE3 hg19 pipeline has 17343020 usable fragments. The minimum ENCODE standard for each replicate in a ChIP-seq experiment targeting H3K4me3-human and investigated as a narrow histone mark is 10 million usable fragments. The recommended value is > 20 million, but > 10 million is acceptable. (See {ENCODE ChIP-seq data standards|/data-standards/chip-seq/}) audit_warning: PBC1 (PCR Bottlenecking Coefficient 1, M1/M_distinct) is the ratio of the number of genomic locations where exactly one read maps uniquely (M1) to the number of genomic locations where some reads map (M_distinct). A PBC1 value in the range 0 - 0.5 is severe bottlenecking, 0.5 - 0.8 is moderate bottlenecking, 0.8 - 0.9 is mild bottlenecking, and > 0.9 is no bottlenecking. PBC1 value > 0.9 is recommended, but > 0.8 is acceptable. ENCODE processed alignments file {ENCFF426CQE|/files/ENCFF426CQE/} processed by ChIP-seq ENCODE3 hg19 pipeline was generated from a library with PBC1 value of 0.85. audit_warning: PBC2 (PCR Bottlenecking Coefficient 2, M1/M2) is the ratio of the number of genomic locations where exactly one read maps uniquely (M1) to the number of genomic locations where two reads map uniquely (M2). A PBC2 value in the range 0 - 1 is severe bottlenecking, 1 - 3 is moderate bottlenecking, 3 - 10 is mild bottlenecking, > 10 is no bottlenecking. PBC2 value > 10 is recommended, but > 3 is acceptable. ENCODE processed alignments file {ENCFF426CQE|/files/ENCFF426CQE/} processed by ChIP-seq ENCODE3 hg19 pipeline was generated from a library with PBC2 value of 7.88. audit_warning: PBC1 (PCR Bottlenecking Coefficient 1, M1/M_distinct) is the ratio of the number of genomic locations where exactly one read maps uniquely (M1) to the number of genomic locations where some reads map (M_distinct). A PBC1 value in the range 0 - 0.5 is severe bottlenecking, 0.5 - 0.8 is moderate bottlenecking, 0.8 - 0.9 is mild bottlenecking, and > 0.9 is no bottlenecking. PBC1 value > 0.9 is recommended, but > 0.8 is acceptable. ENCODE processed alignments file {ENCFF440CVG|/files/ENCFF440CVG/} processed by ChIP-seq ENCODE3 hg19 pipeline was generated from a library with PBC1 value of 0.83. audit_warning: PBC2 (PCR Bottlenecking Coefficient 2, M1/M2) is the ratio of the number of genomic locations where exactly one read maps uniquely (M1) to the number of genomic locations where two reads map uniquely (M2). A PBC2 value in the range 0 - 1 is severe bottlenecking, 1 - 3 is moderate bottlenecking, 3 - 10 is mild bottlenecking, > 10 is no bottlenecking. PBC2 value > 10 is recommended, but > 3 is acceptable. ENCODE processed alignments file {ENCFF440CVG|/files/ENCFF440CVG/} processed by ChIP-seq ENCODE3 hg19 pipeline was generated from a library with PBC2 value of 6.88. |
| Labels |
|
Scores (1)
| ID | Type | Default annotation | Description | Histogram | Range | Summary |
|---|---|---|---|---|---|---|
| Histone_ChIP-seq_ENCSR000DVC | float |
Histone_ChIP-seq_ENCSR000DVC |
Histone_ChIP-seq ENCSR000DVC [biosample_summary="Homo sapiens fibroblast of lung" and target="H3K4me3"]
|
 |
[1.87, 133] |
|
n counts base pairs; sd is the population standard deviation.
Coverage
| Chromosome | Covered positions | Covered % | Segments |
|---|---|---|---|
| all chromosomes | 38808706 | 1.21% | 44732 |
| chr1 | 3754510 | 1.51% | 4174 |
| chr2 | 2750500 | 1.14% | 3181 |
| chr3 | 2370301 | 1.20% | 2605 |
| chr4 | 1823863 | 0.96% | 2024 |
| chr5 | 2016629 | 1.11% | 2238 |
| chr6 | 2505899 | 1.47% | 2748 |
| chr7 | 1901715 | 1.19% | 2278 |
| chr8 | 1511743 | 1.04% | 1834 |
| chr9 | 1551228 | 1.12% | 1839 |
| chr10 | 1688260 | 1.26% | 2043 |
| chr11 | 2035981 | 1.51% | 2339 |
| chr12 | 2167495 | 1.63% | 2341 |
| chr13 | 905302 | 0.79% | 1099 |
| chr14 | 1239581 | 1.16% | 1394 |
| chr15 | 1268475 | 1.24% | 1466 |
| chr16 | 1312868 | 1.45% | 1658 |
| chr17 | 2017447 | 2.42% | 2383 |
| chr18 | 710131 | 0.88% | 872 |
| chr19 | 2026623 | 3.46% | 2435 |
| chr20 | 908184 | 1.41% | 1085 |
| chr21 | 380042 | 0.81% | 458 |
| chr22 | 688166 | 1.35% | 865 |
| chrX | 1225465 | 0.79% | 1344 |
| chrY | 48298 | 0.08% | 29 |
| 3342 contigs with no values (129077085 bp) | 0 | 0.00% | 0 |
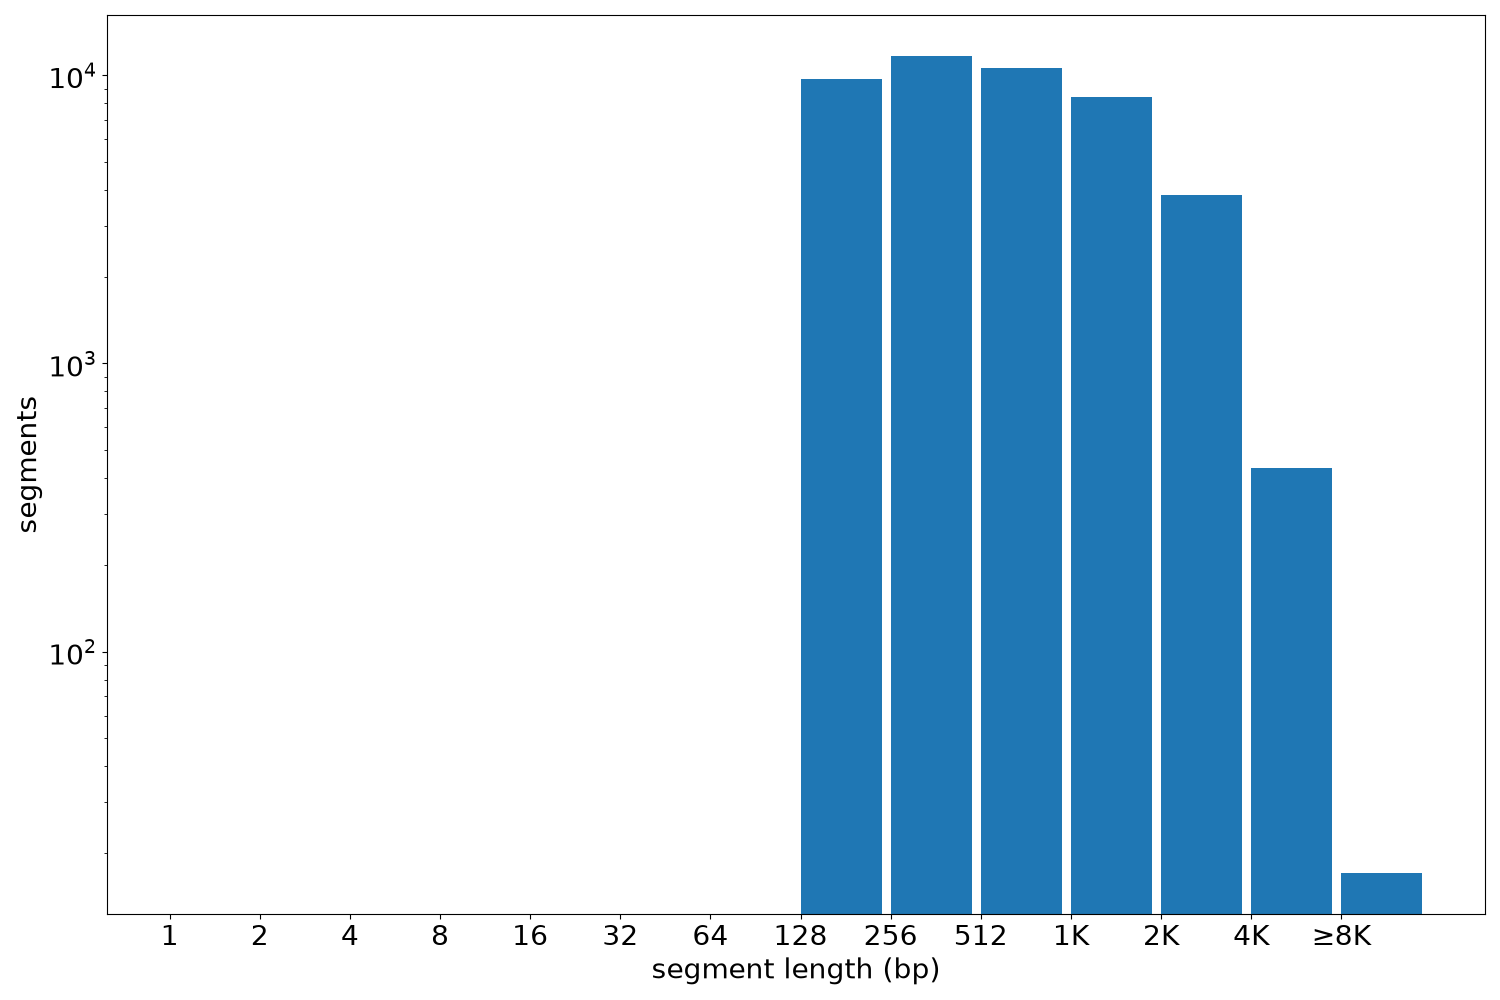
Segment lengths
| segments | min | max | mean | median | |
|---|---|---|---|---|---|
| segments | 44732 | 140 | 17862 | 867.58 | 541 |
Files
| Filename | Size | md5 |
|---|---|---|
| ENCFF069BDK.bed.gz | 1.1 MB | c35e275a231e4507172776e45576c078 |
| ENCFF069BDK.tabix.bed.gz | 494.56 KB | a371de98503a4e5e0e9c4bc7b65a9fad |
| ENCFF069BDK.tabix.bed.gz.tbi | 191.13 KB | 50be8b9fdc1daa4aa65d589f0df7fbb2 |
| genomic_resource.yaml | 4.99 KB | c08eb82ca6a01c62a2b506239a9582fe |
| statistics/ |