Resource
| Id | Histone_ChIP-seq/ENCSR000DUF |
|---|---|
| Type | position_score |
| Version | 0 |
| Summary | Histone_ChIP-seq ENCSR000DUF [biosample_summary="Homo sapiens HepG2" and target="H3K4me3"] |
| Description |
status: released biological_replicates: Rep 1, Rep 2 summary: output_type: replicated peaks audit_internal_action: Archived analysis {ENCAN264CHY|/analyses/ENCAN264CHY/} has in progress subobject quality standard {encode3-histone-chip|/quality-standards/encode3-histone-chip/} audit_warning: Processed alignments file {ENCFF663ZBD|/files/ENCFF663ZBD/} processed by ChIP-seq ENCODE3 hg19 pipeline has 11307693 usable fragments. The minimum ENCODE standard for each replicate in a ChIP-seq experiment targeting H3K4me3-human and investigated as a narrow histone mark is 10 million usable fragments. The recommended value is > 20 million, but > 10 million is acceptable. (See {ENCODE ChIP-seq data standards|/data-standards/chip-seq/}) audit_warning: Processed alignments file {ENCFF053ZWM|/files/ENCFF053ZWM/} processed by ChIP-seq ENCODE3 hg19 pipeline has 11534142 usable fragments. The minimum ENCODE standard for each replicate in a ChIP-seq experiment targeting H3K4me3-human and investigated as a narrow histone mark is 10 million usable fragments. The recommended value is > 20 million, but > 10 million is acceptable. (See {ENCODE ChIP-seq data standards|/data-standards/chip-seq/}) audit_warning: PBC1 (PCR Bottlenecking Coefficient 1, M1/M_distinct) is the ratio of the number of genomic locations where exactly one read maps uniquely (M1) to the number of genomic locations where some reads map (M_distinct). A PBC1 value in the range 0 - 0.5 is severe bottlenecking, 0.5 - 0.8 is moderate bottlenecking, 0.8 - 0.9 is mild bottlenecking, and > 0.9 is no bottlenecking. PBC1 value > 0.9 is recommended, but > 0.8 is acceptable. ENCODE processed alignments file {ENCFF663ZBD|/files/ENCFF663ZBD/} processed by ChIP-seq ENCODE3 hg19 pipeline was generated from a library with PBC1 value of 0.88. audit_warning: PBC2 (PCR Bottlenecking Coefficient 2, M1/M2) is the ratio of the number of genomic locations where exactly one read maps uniquely (M1) to the number of genomic locations where two reads map uniquely (M2). A PBC2 value in the range 0 - 1 is severe bottlenecking, 1 - 3 is moderate bottlenecking, 3 - 10 is mild bottlenecking, > 10 is no bottlenecking. PBC2 value > 10 is recommended, but > 3 is acceptable. ENCODE processed alignments file {ENCFF663ZBD|/files/ENCFF663ZBD/} processed by ChIP-seq ENCODE3 hg19 pipeline was generated from a library with PBC2 value of 9.25. audit_warning: PBC1 (PCR Bottlenecking Coefficient 1, M1/M_distinct) is the ratio of the number of genomic locations where exactly one read maps uniquely (M1) to the number of genomic locations where some reads map (M_distinct). A PBC1 value in the range 0 - 0.5 is severe bottlenecking, 0.5 - 0.8 is moderate bottlenecking, 0.8 - 0.9 is mild bottlenecking, and > 0.9 is no bottlenecking. PBC1 value > 0.9 is recommended, but > 0.8 is acceptable. ENCODE processed alignments file {ENCFF053ZWM|/files/ENCFF053ZWM/} processed by ChIP-seq ENCODE3 hg19 pipeline was generated from a library with PBC1 value of 0.89. audit_warning: PBC2 (PCR Bottlenecking Coefficient 2, M1/M2) is the ratio of the number of genomic locations where exactly one read maps uniquely (M1) to the number of genomic locations where two reads map uniquely (M2). A PBC2 value in the range 0 - 1 is severe bottlenecking, 1 - 3 is moderate bottlenecking, 3 - 10 is mild bottlenecking, > 10 is no bottlenecking. PBC2 value > 10 is recommended, but > 3 is acceptable. ENCODE processed alignments file {ENCFF053ZWM|/files/ENCFF053ZWM/} processed by ChIP-seq ENCODE3 hg19 pipeline was generated from a library with PBC2 value of 9.59. |
| Labels |
|
Scores (1)
| ID | Type | Default annotation | Description | Histogram | Range | Summary |
|---|---|---|---|---|---|---|
| Histone_ChIP-seq_ENCSR000DUF | float |
Histone_ChIP-seq_ENCSR000DUF |
Histone_ChIP-seq ENCSR000DUF [biosample_summary="Homo sapiens HepG2" and target="H3K4me3"]
|
 |
[1.83, 114] |
|
n counts base pairs; sd is the population standard deviation.
Coverage
| Chromosome | Covered positions | Covered % | Segments |
|---|---|---|---|
| all chromosomes | 37211341 | 1.16% | 35504 |
| chr1 | 3728410 | 1.50% | 3622 |
| chr2 | 2638925 | 1.09% | 2440 |
| chr3 | 2044988 | 1.03% | 1839 |
| chr4 | 1371703 | 0.72% | 1267 |
| chr5 | 1694998 | 0.93% | 1594 |
| chr6 | 2164447 | 1.27% | 1913 |
| chr7 | 1738801 | 1.09% | 1734 |
| chr8 | 1335700 | 0.92% | 1202 |
| chr9 | 1553479 | 1.12% | 1503 |
| chr10 | 1557799 | 1.16% | 1475 |
| chr11 | 1923613 | 1.42% | 1802 |
| chr12 | 1890948 | 1.42% | 1759 |
| chr13 | 706340 | 0.62% | 695 |
| chr14 | 1308828 | 1.22% | 1214 |
| chr15 | 1139709 | 1.12% | 1122 |
| chr16 | 1688678 | 1.87% | 1670 |
| chr17 | 2296149 | 2.76% | 2210 |
| chr18 | 614340 | 0.76% | 578 |
| chr19 | 2311452 | 3.94% | 2387 |
| chr20 | 1102235 | 1.71% | 1013 |
| chr21 | 410159 | 0.88% | 444 |
| chr22 | 882655 | 1.74% | 942 |
| chrX | 1067501 | 0.68% | 1046 |
| chrY | 39484 | 0.07% | 33 |
| 3342 contigs with no values (129077085 bp) | 0 | 0.00% | 0 |
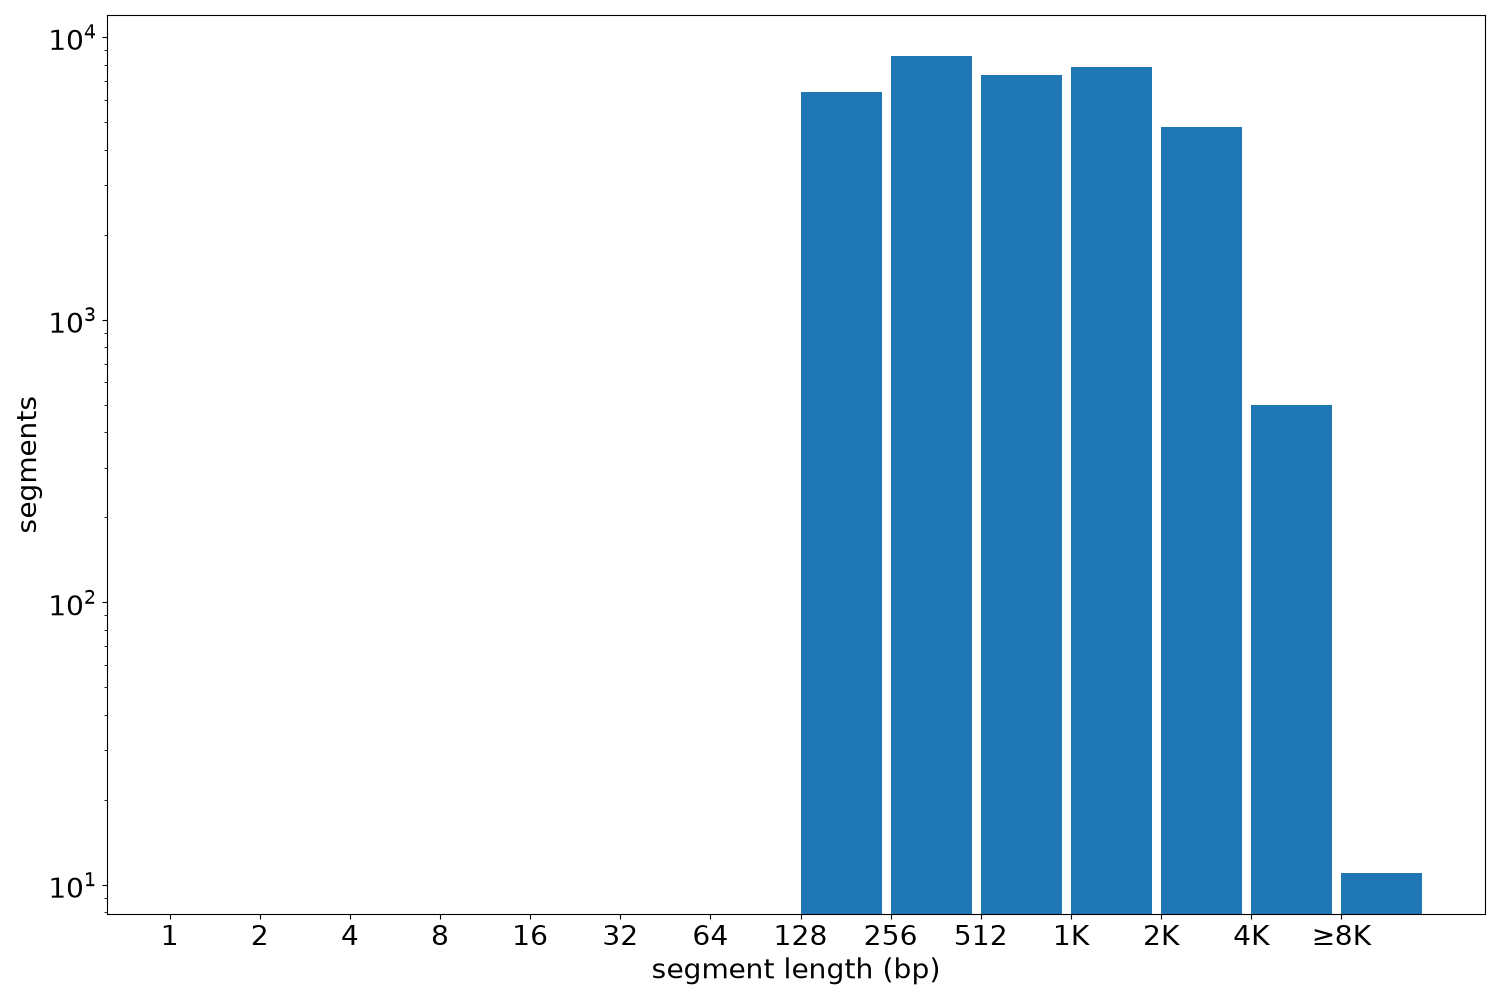
Segment lengths
| segments | min | max | mean | median | |
|---|---|---|---|---|---|
| segments | 35504 | 155 | 10466 | 1048.09 | 660 |
Files
| Filename | Size | md5 |
|---|---|---|
| ENCFF712HMU.bed.gz | 923.63 KB | 716624a776f9f6d22890dec6ba2f4798 |
| ENCFF712HMU.tabix.bed.gz | 398.4 KB | 747276115c8b3c3dba05412f48675d31 |
| ENCFF712HMU.tabix.bed.gz.tbi | 160.46 KB | 6c84d570c21080b5077ceac33be9bae4 |
| genomic_resource.yaml | 4.95 KB | 66c4ab4bc4347c52968cad058172997b |
| statistics/ |