Resource
| Id | Histone_ChIP-seq/ENCSR000DTY |
|---|---|
| Type | position_score |
| Version | 0 |
| Summary | Histone_ChIP-seq ENCSR000DTY [biosample_summary="Homo sapiens HeLa-S3 G1b phase" and target="H3K27me3"] |
| Description |
status: released biological_replicates: Rep 1, Rep 2 summary: G1b phase output_type: replicated peaks audit_internal_action: Archived analysis {ENCAN905ZCO|/analyses/ENCAN905ZCO/} has in progress subobject quality standard {encode3-histone-chip|/quality-standards/encode3-histone-chip/} audit_not_compliant: Processed alignments file {ENCFF847OPB|/files/ENCFF847OPB/} processed by ChIP-seq ENCODE3 hg19 pipeline has 7304614 usable fragments. The minimum ENCODE standard for each replicate in a ChIP-seq experiment targeting H3K27me3-human and investigated as a broad histone mark is 20 million usable fragments. The recommended value is > 45 million, but > 35 million is acceptable. (See {ENCODE ChIP-seq data standards|/data-standards/chip-seq/}) audit_not_compliant: Processed alignments file {ENCFF688FAK|/files/ENCFF688FAK/} processed by ChIP-seq ENCODE3 hg19 pipeline has 6689914 usable fragments. The minimum ENCODE standard for each replicate in a ChIP-seq experiment targeting H3K27me3-human and investigated as a broad histone mark is 20 million usable fragments. The recommended value is > 45 million, but > 35 million is acceptable. (See {ENCODE ChIP-seq data standards|/data-standards/chip-seq/}) audit_warning: NRF (Non Redundant Fraction) is equal to the result of the division of the number of reads after duplicates removal by the total number of reads. An NRF value in the range 0 - 0.5 is poor complexity, 0.5 - 0.8 is moderate complexity, and > 0.8 high complexity. NRF value > 0.8 is recommended, but > 0.5 is acceptable. ENCODE processed alignments file {ENCFF847OPB|/files/ENCFF847OPB/} processed by ChIP-seq ENCODE3 hg19 pipeline was generated from a library with NRF value of 0.63. audit_warning: PBC1 (PCR Bottlenecking Coefficient 1, M1/M_distinct) is the ratio of the number of genomic locations where exactly one read maps uniquely (M1) to the number of genomic locations where some reads map (M_distinct). A PBC1 value in the range 0 - 0.5 is severe bottlenecking, 0.5 - 0.8 is moderate bottlenecking, 0.8 - 0.9 is mild bottlenecking, and > 0.9 is no bottlenecking. PBC1 value > 0.9 is recommended, but > 0.8 is acceptable. ENCODE processed alignments file {ENCFF847OPB|/files/ENCFF847OPB/} processed by ChIP-seq ENCODE3 hg19 pipeline was generated from a library with PBC1 value of 0.60. audit_warning: PBC2 (PCR Bottlenecking Coefficient 2, M1/M2) is the ratio of the number of genomic locations where exactly one read maps uniquely (M1) to the number of genomic locations where two reads map uniquely (M2). A PBC2 value in the range 0 - 1 is severe bottlenecking, 1 - 3 is moderate bottlenecking, 3 - 10 is mild bottlenecking, > 10 is no bottlenecking. PBC2 value > 10 is recommended, but > 3 is acceptable. ENCODE processed alignments file {ENCFF847OPB|/files/ENCFF847OPB/} processed by ChIP-seq ENCODE3 hg19 pipeline was generated from a library with PBC2 value of 2.33. audit_warning: NRF (Non Redundant Fraction) is equal to the result of the division of the number of reads after duplicates removal by the total number of reads. An NRF value in the range 0 - 0.5 is poor complexity, 0.5 - 0.8 is moderate complexity, and > 0.8 high complexity. NRF value > 0.8 is recommended, but > 0.5 is acceptable. ENCODE processed alignments file {ENCFF688FAK|/files/ENCFF688FAK/} processed by ChIP-seq ENCODE3 hg19 pipeline was generated from a library with NRF value of 0.62. audit_warning: PBC1 (PCR Bottlenecking Coefficient 1, M1/M_distinct) is the ratio of the number of genomic locations where exactly one read maps uniquely (M1) to the number of genomic locations where some reads map (M_distinct). A PBC1 value in the range 0 - 0.5 is severe bottlenecking, 0.5 - 0.8 is moderate bottlenecking, 0.8 - 0.9 is mild bottlenecking, and > 0.9 is no bottlenecking. PBC1 value > 0.9 is recommended, but > 0.8 is acceptable. ENCODE processed alignments file {ENCFF688FAK|/files/ENCFF688FAK/} processed by ChIP-seq ENCODE3 hg19 pipeline was generated from a library with PBC1 value of 0.59. audit_warning: PBC2 (PCR Bottlenecking Coefficient 2, M1/M2) is the ratio of the number of genomic locations where exactly one read maps uniquely (M1) to the number of genomic locations where two reads map uniquely (M2). A PBC2 value in the range 0 - 1 is severe bottlenecking, 1 - 3 is moderate bottlenecking, 3 - 10 is mild bottlenecking, > 10 is no bottlenecking. PBC2 value > 10 is recommended, but > 3 is acceptable. ENCODE processed alignments file {ENCFF688FAK|/files/ENCFF688FAK/} processed by ChIP-seq ENCODE3 hg19 pipeline was generated from a library with PBC2 value of 2.25. |
| Labels |
|
Scores (1)
| ID | Type | Default annotation | Description | Histogram | Range | Summary |
|---|---|---|---|---|---|---|
| Histone_ChIP-seq_ENCSR000DTY | float |
Histone_ChIP-seq_ENCSR000DTY |
Histone_ChIP-seq ENCSR000DTY [biosample_summary="Homo sapiens HeLa-S3 G1b phase" and target="H3K27me3"]
|
 |
[1.29, 27.6] |
|
n counts base pairs; sd is the population standard deviation.
Coverage
| Chromosome | Covered positions | Covered % | Segments |
|---|---|---|---|
| all chromosomes | 1851534 | 0.06% | 13050 |
| chr1 | 202695 | 0.08% | 1409 |
| chr2 | 89794 | 0.04% | 653 |
| chr3 | 98422 | 0.05% | 715 |
| chr4 | 27536 | 0.01% | 212 |
| chr5 | 122710 | 0.07% | 848 |
| chr6 | 77832 | 0.05% | 572 |
| chr7 | 116518 | 0.07% | 822 |
| chr8 | 116504 | 0.08% | 814 |
| chr9 | 90230 | 0.07% | 602 |
| chr10 | 97312 | 0.07% | 690 |
| chr11 | 94702 | 0.07% | 658 |
| chr12 | 101946 | 0.08% | 735 |
| chr13 | 50132 | 0.04% | 369 |
| chr14 | 57960 | 0.05% | 408 |
| chr15 | 67423 | 0.07% | 467 |
| chr16 | 77767 | 0.09% | 542 |
| chr17 | 90100 | 0.11% | 625 |
| chr18 | 55540 | 0.07% | 403 |
| chr19 | 44623 | 0.08% | 318 |
| chr20 | 83071 | 0.13% | 527 |
| chr21 | 23809 | 0.05% | 171 |
| chr22 | 24348 | 0.05% | 179 |
| chrX | 40560 | 0.03% | 311 |
| 3343 contigs with no values (186304500 bp) | 0 | 0.00% | 0 |
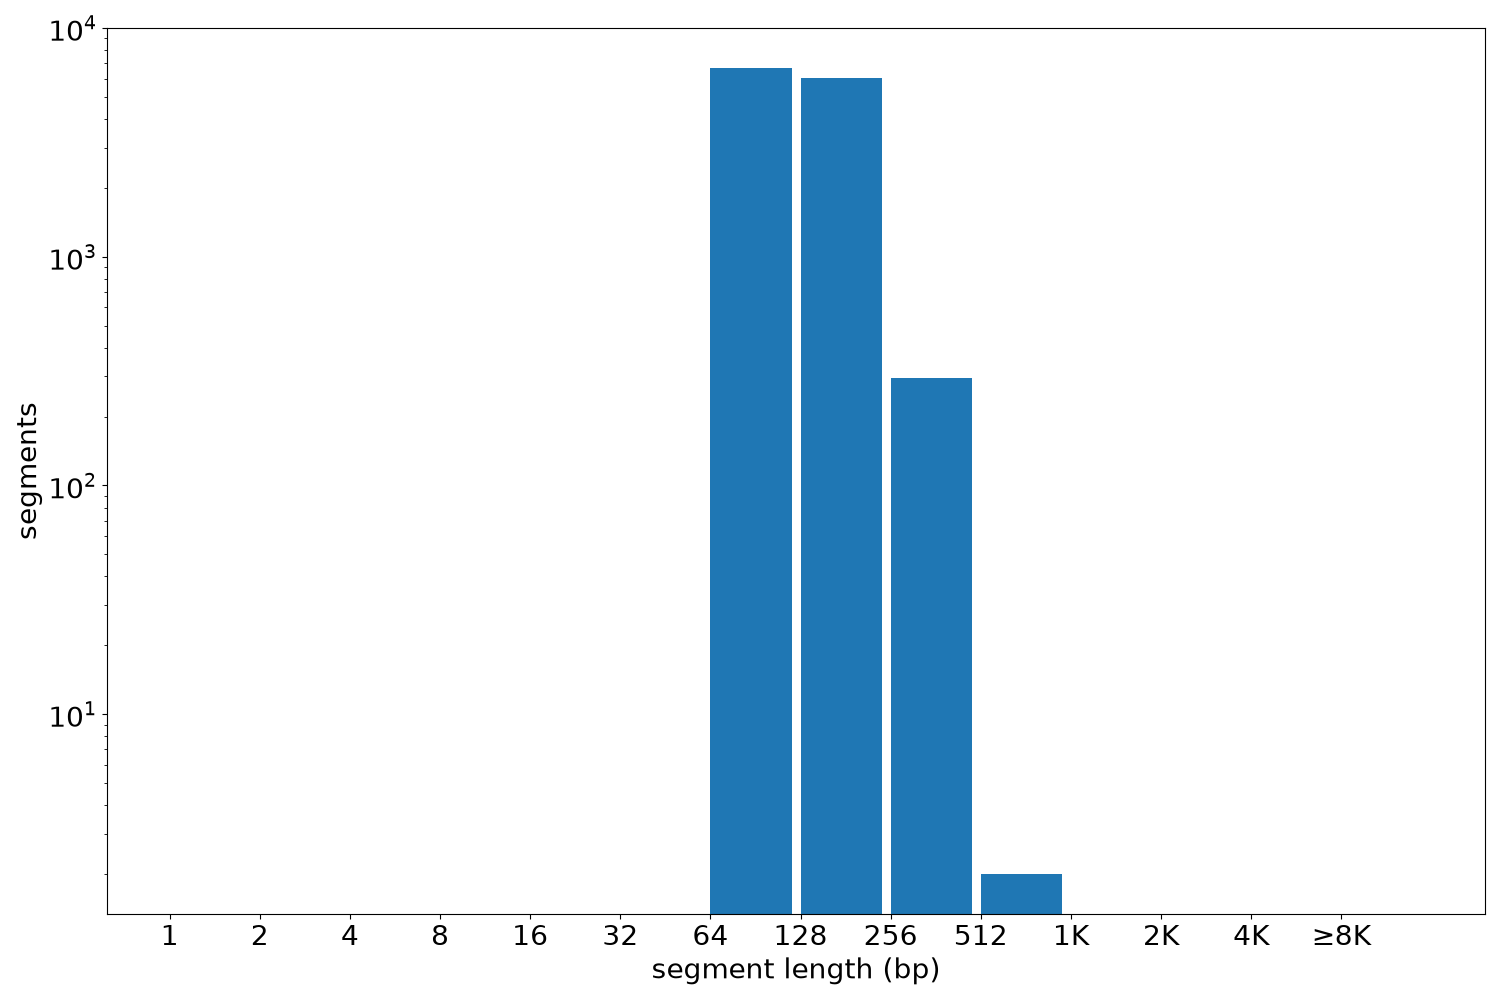
Segment lengths
| segments | min | max | mean | median | |
|---|---|---|---|---|---|
| segments | 13050 | 110 | 865 | 141.88 | 126 |
Files
| Filename | Size | md5 |
|---|---|---|
| ENCFF410YQK.bed.gz | 220.54 KB | c3ca0bd7d028db0086e425cc48571dd5 |
| ENCFF410YQK.tabix.bed.gz | 122.48 KB | 478c95f29d2e197335879971f562688e |
| ENCFF410YQK.tabix.bed.gz.tbi | 102.95 KB | 3e872ca75708c6374efda017b6ffb357 |
| genomic_resource.yaml | 6.21 KB | e26b700afe909cfe6f7f8f6cf0fa5fb7 |
| statistics/ |