Resource
| Id | Histone_ChIP-seq/ENCSR000DRY |
|---|---|
| Type | position_score |
| Version | 0 |
| Summary | Histone_ChIP-seq ENCSR000DRY [biosample_summary="Homo sapiens GM12878" and target="H3K4me3"] |
| Description |
status: released biological_replicates: Rep 1, Rep 2 summary: output_type: replicated peaks audit_internal_action: Archived analysis {ENCAN413OBZ|/analyses/ENCAN413OBZ/} has in progress subobject quality standard {encode3-histone-chip|/quality-standards/encode3-histone-chip/} audit_warning: Processed alignments file {ENCFF822SQU|/files/ENCFF822SQU/} processed by ChIP-seq ENCODE3 GRCh38 pipeline has 14556240 usable fragments. The minimum ENCODE standard for each replicate in a ChIP-seq experiment targeting H3K4me3-human and investigated as a narrow histone mark is 10 million usable fragments. The recommended value is > 20 million, but > 10 million is acceptable. (See {ENCODE ChIP-seq data standards|/data-standards/chip-seq/}) audit_warning: Processed alignments file {ENCFF147ZCK|/files/ENCFF147ZCK/} processed by ChIP-seq ENCODE3 GRCh38 pipeline has 17411006 usable fragments. The minimum ENCODE standard for each replicate in a ChIP-seq experiment targeting H3K4me3-human and investigated as a narrow histone mark is 10 million usable fragments. The recommended value is > 20 million, but > 10 million is acceptable. (See {ENCODE ChIP-seq data standards|/data-standards/chip-seq/}) audit_warning: PBC1 (PCR Bottlenecking Coefficient 1, M1/M_distinct) is the ratio of the number of genomic locations where exactly one read maps uniquely (M1) to the number of genomic locations where some reads map (M_distinct). A PBC1 value in the range 0 - 0.5 is severe bottlenecking, 0.5 - 0.8 is moderate bottlenecking, 0.8 - 0.9 is mild bottlenecking, and > 0.9 is no bottlenecking. PBC1 value > 0.9 is recommended, but > 0.8 is acceptable. ENCODE processed alignments file {ENCFF822SQU|/files/ENCFF822SQU/} processed by ChIP-seq ENCODE3 GRCh38 pipeline was generated from a library with PBC1 value of 0.89. audit_warning: PBC2 (PCR Bottlenecking Coefficient 2, M1/M2) is the ratio of the number of genomic locations where exactly one read maps uniquely (M1) to the number of genomic locations where two reads map uniquely (M2). A PBC2 value in the range 0 - 1 is severe bottlenecking, 1 - 3 is moderate bottlenecking, 3 - 10 is mild bottlenecking, > 10 is no bottlenecking. PBC2 value > 10 is recommended, but > 3 is acceptable. ENCODE processed alignments file {ENCFF822SQU|/files/ENCFF822SQU/} processed by ChIP-seq ENCODE3 GRCh38 pipeline was generated from a library with PBC2 value of 9.80. audit_warning: PBC1 (PCR Bottlenecking Coefficient 1, M1/M_distinct) is the ratio of the number of genomic locations where exactly one read maps uniquely (M1) to the number of genomic locations where some reads map (M_distinct). A PBC1 value in the range 0 - 0.5 is severe bottlenecking, 0.5 - 0.8 is moderate bottlenecking, 0.8 - 0.9 is mild bottlenecking, and > 0.9 is no bottlenecking. PBC1 value > 0.9 is recommended, but > 0.8 is acceptable. ENCODE processed alignments file {ENCFF147ZCK|/files/ENCFF147ZCK/} processed by ChIP-seq ENCODE3 GRCh38 pipeline was generated from a library with PBC1 value of 0.88. audit_warning: PBC2 (PCR Bottlenecking Coefficient 2, M1/M2) is the ratio of the number of genomic locations where exactly one read maps uniquely (M1) to the number of genomic locations where two reads map uniquely (M2). A PBC2 value in the range 0 - 1 is severe bottlenecking, 1 - 3 is moderate bottlenecking, 3 - 10 is mild bottlenecking, > 10 is no bottlenecking. PBC2 value > 10 is recommended, but > 3 is acceptable. ENCODE processed alignments file {ENCFF147ZCK|/files/ENCFF147ZCK/} processed by ChIP-seq ENCODE3 GRCh38 pipeline was generated from a library with PBC2 value of 8.92. |
| Labels |
|
Scores (1)
| ID | Type | Default annotation | Description | Histogram | Range | Summary |
|---|---|---|---|---|---|---|
| Histone_ChIP-seq_ENCSR000DRY | float |
Histone_ChIP-seq_ENCSR000DRY |
Histone_ChIP-seq ENCSR000DRY [biosample_summary="Homo sapiens GM12878" and target="H3K4me3"]
|
 |
[1.87, 88.6] |
|
n counts base pairs; sd is the population standard deviation.
Coverage
| Chromosome | Covered positions | Covered % | Segments |
|---|---|---|---|
| all chromosomes | 44729824 | 1.39% | 40363 |
| chr1 | 4428524 | 1.78% | 4053 |
| chr2 | 3157434 | 1.30% | 2841 |
| chr3 | 2576859 | 1.30% | 2252 |
| chr4 | 1686684 | 0.89% | 1557 |
| chr5 | 2284637 | 1.26% | 1950 |
| chr6 | 2808881 | 1.64% | 2508 |
| chr7 | 2060142 | 1.29% | 1932 |
| chr8 | 1645758 | 1.13% | 1433 |
| chr9 | 1794166 | 1.30% | 1595 |
| chr10 | 1825817 | 1.36% | 1640 |
| chr11 | 2273413 | 1.68% | 1963 |
| chr12 | 2427409 | 1.82% | 2124 |
| chr13 | 885637 | 0.77% | 819 |
| chr14 | 1526400 | 1.43% | 1410 |
| chr15 | 1508151 | 1.48% | 1371 |
| chr16 | 1819725 | 2.01% | 1682 |
| chr17 | 2593780 | 3.12% | 2340 |
| chr17_GL000205v2_random | 3670 | 1.98% | 5 |
| chr18 | 744838 | 0.93% | 633 |
| chr19 | 2658860 | 4.54% | 2439 |
| chr20 | 1160361 | 1.80% | 1076 |
| chr21 | 448496 | 0.96% | 387 |
| chr22 | 1067019 | 2.10% | 1005 |
| chrEBV | 10116 | 5.89% | 8 |
| chrUn_GL000219v1 | 2771 | 1.55% | 8 |
| chrUn_GL000220v1 | 239 | 0.15% | 1 |
| chrX | 1330037 | 0.85% | 1331 |
| 3339 contigs with no values (185606086 bp) | 0 | 0.00% | 0 |
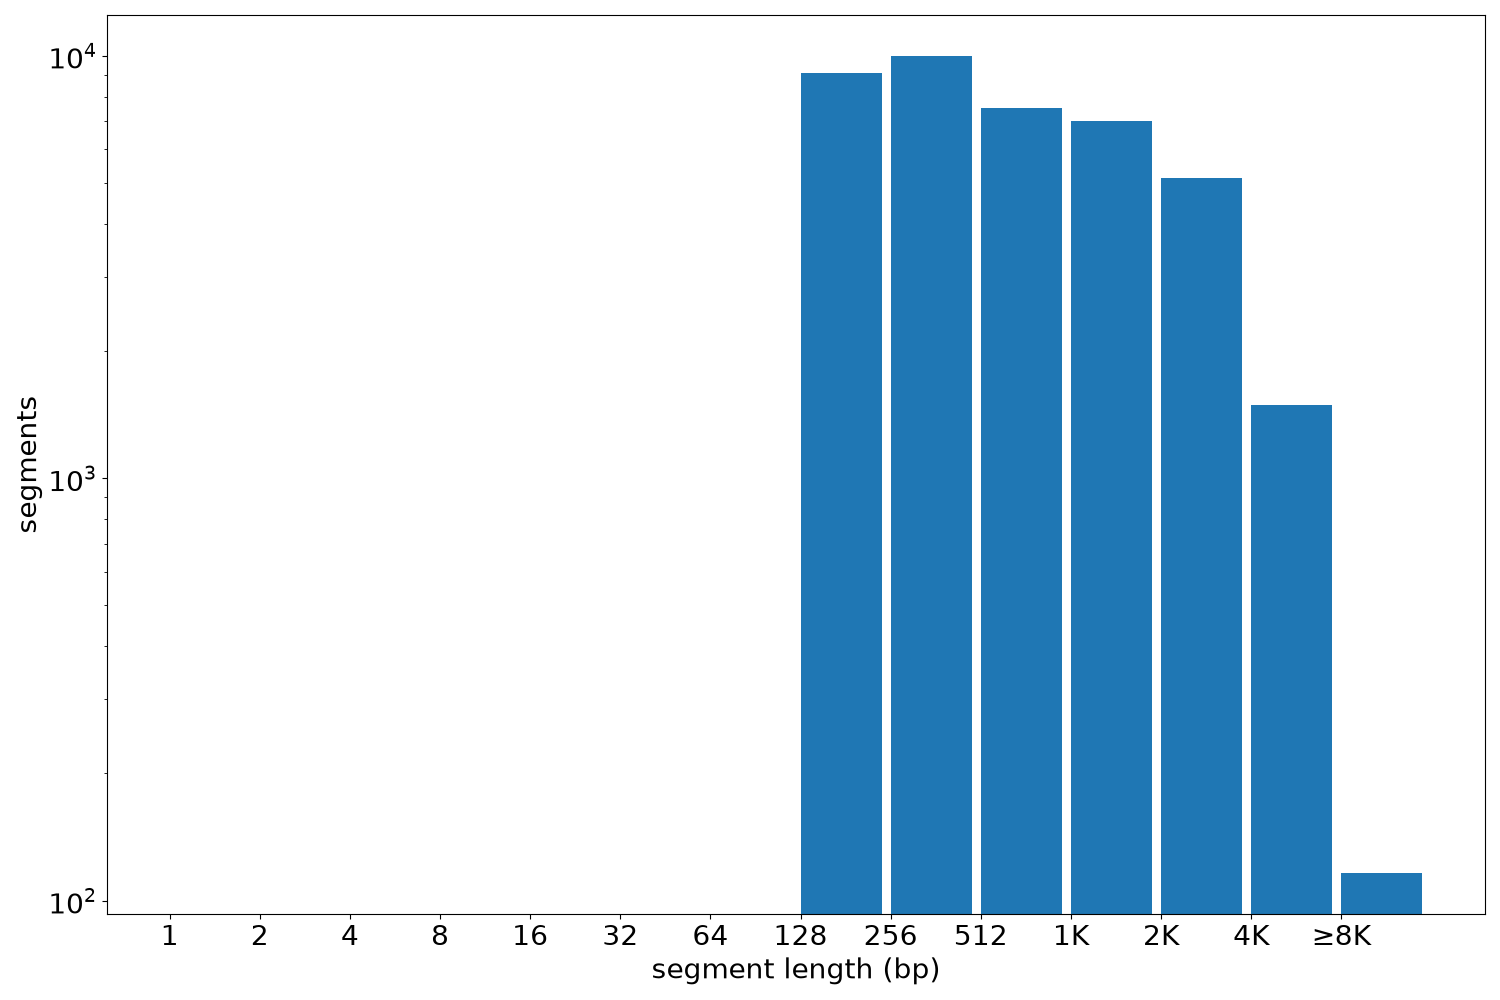
Segment lengths
| segments | min | max | mean | median | |
|---|---|---|---|---|---|
| segments | 40363 | 135 | 16758 | 1108.19 | 559 |
Files
| Filename | Size | md5 |
|---|---|---|
| ENCFF636FWF.bed.gz | 964.66 KB | b15fe763b45e6ee0e473927caa1cec64 |
| ENCFF636FWF.tabix.bed.gz | 439.53 KB | 47871922783945078742065951c447f3 |
| ENCFF636FWF.tabix.bed.gz.tbi | 136.73 KB | 534e91de38bd9cd5e960bbc46e5a08c4 |
| genomic_resource.yaml | 5.26 KB | fab92c76497f49e4981bbc305e8b14fc |
| statistics/ |